
For the interferometric analysis during the period 1993-2010, the entire available archive of ERS-1/2 and ENVISAT data for the area of interest from both descending and ascending orbits was used.
Descending orbit (period 1993-2010)
For the interferometric analysis performed with data acquired by satellite from a descending orbit (track 208), 141 satellite images were used for the period May 1993 - September 2010; Figure 1 shows the distribution of these data in the perpendicular time/baseline plane (orbital separation). In particular, the black and red rhombuses represent the ERS-1/2 and ENVISAT data, respectively. Table 1 shows the main characteristics of the dataset used.
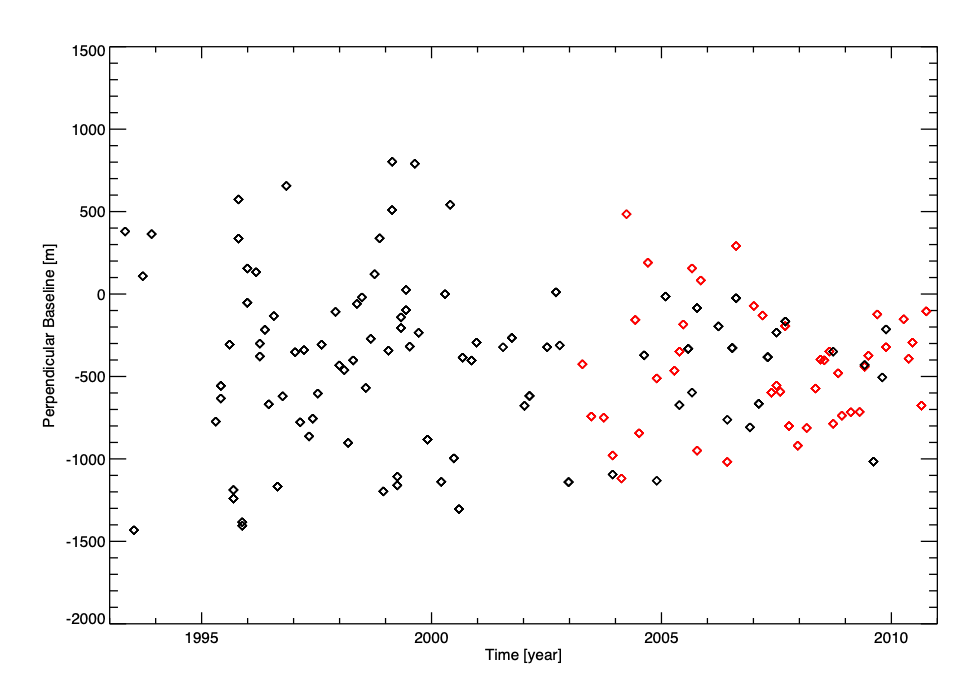
Figure description
Perpendicular Baseline [m]: -2000 - 1500. Time [year]: 1995 - 2010.
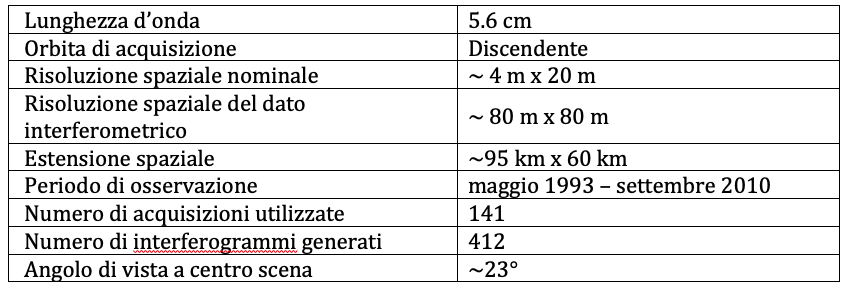
| Lunghezza d’onda | 5.6 cm |
|---|---|
| Orbita di acquisizione | Discendente |
| Risoluzione spaziale nominale | ~ 4 m x 20 m |
| Risoluzione spaziale del dato interferometrico | ~ 80 m x 80 m |
| Estensione spaziale | ~95 km x 60 km |
| Periodo di osservazione | maggio 1993 – settembre 2010 |
| Numero di acquisizioni utilizzate | 141 |
| Numero di interferogrammi generati | 412 |
| Angolo di vista a centro scena | ~23° |
Ascending orbit (period 1995-2010)
For the interferometric analysis performed with data acquired by satellite from an ascending orbit, 76 satellite images (26 ERS-1/2 and 50 ENVISAT) were used for the period June 1995 - October 2010, whose distribution in the perpendicular time/baseline plan is shown in Figure 2, where the black and red rhombuses represent the ERS-1/2 and ENVISAT data, respectively. Table 2 shows the main characteristics of the dataset used.
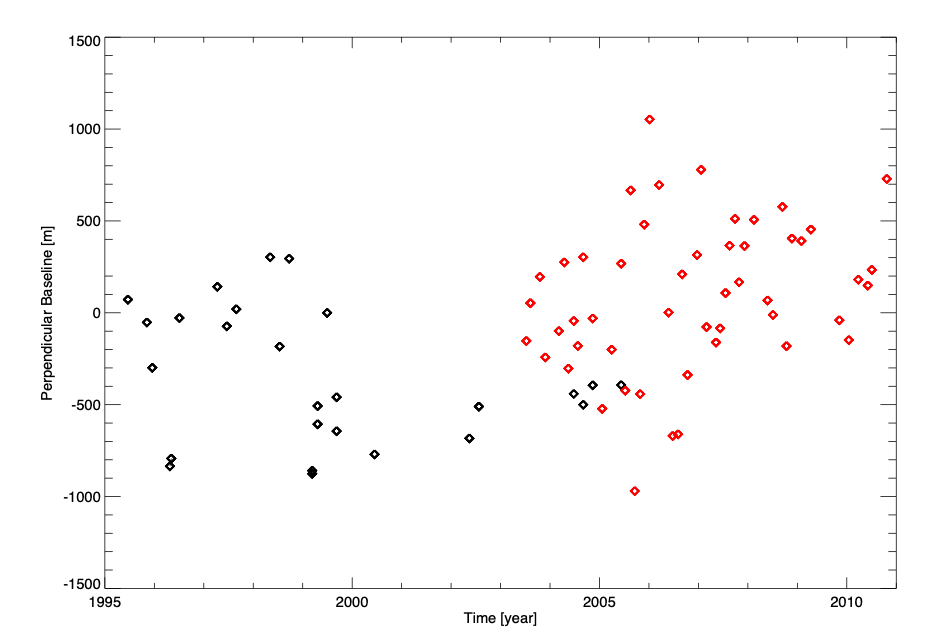
Figure description
Perpendicular Baseline [m]: -1500 - 1500. Time [year]: 1995 - 2010.
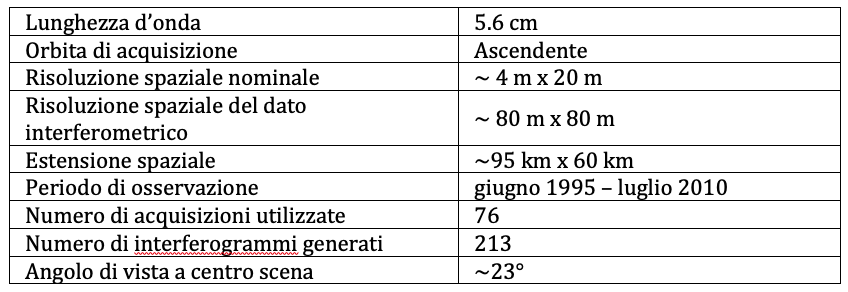
| Lunghezza d’onda | 5.6 cm |
|---|---|
| Orbita di acquisizione | Ascendente |
| Risoluzione spaziale nominale | ~ 4 m x 20 m |
| Risoluzione spaziale del dato interferometrico | ~ 80 m x 80 m |
| Estensione spaziale | ~95 km x 60 km |
| Periodo di osservazione | giugno 1995 – luglio 2010 |
| Numero di acquisizioni utilizzate | 76 |
| Numero di interferogrammi generati | 213 |
| Angolo di vista a centro scena | ~23° |