
The interferometric analysis for the period March 2015 - May 2019 was performed using the SBAS-DInSAR technique using Sentinel-1 (S-1) data for the area of interest and corresponding to 200 images acquired along ascending orbits and 191 along descending orbits.
Figure 1 shows the distribution of S-1 data in the time/baseline-perpendicular plane.
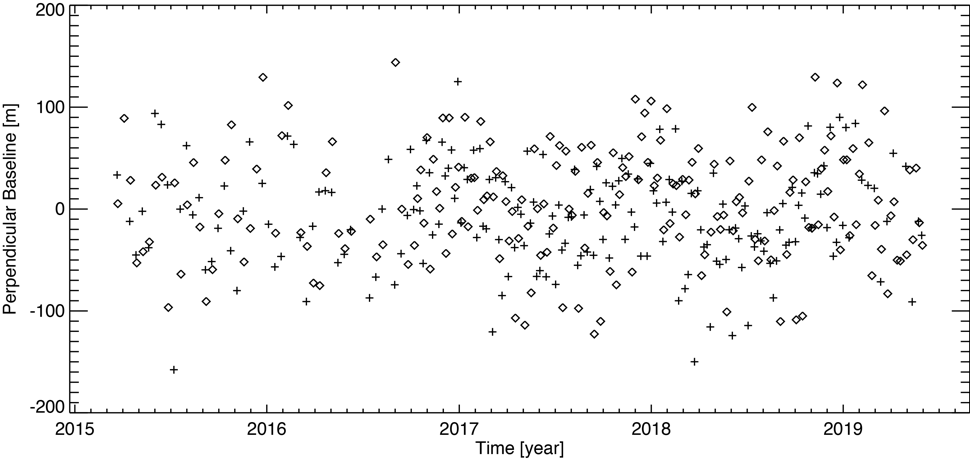
Figure 2 and Figure 3 show the S-1 data distributions in the time/baseline-perpendicular plane acquired from descending and ascending orbits, respectively. The black and red triangles represent the S-1A and S-1B data.
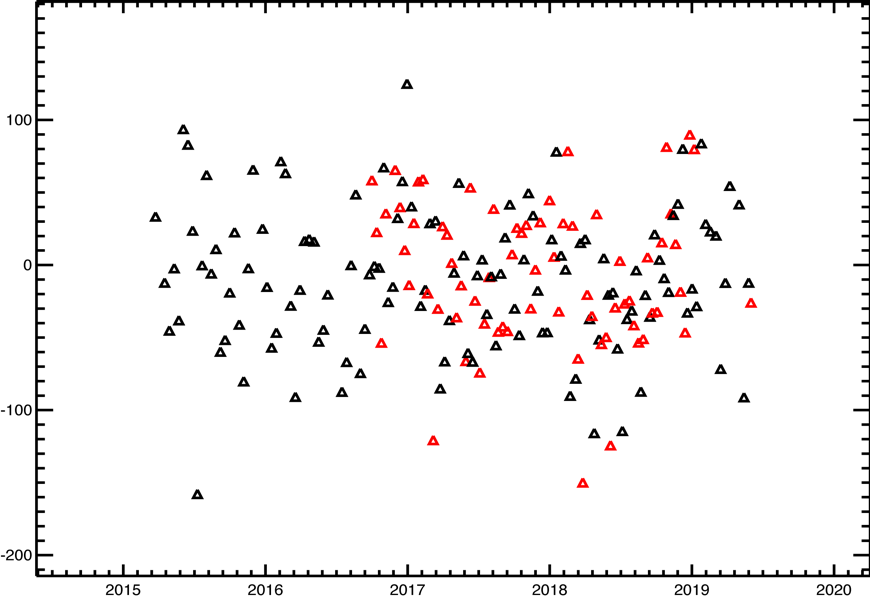
Figure description
2015 - 2020; -200 - 100.
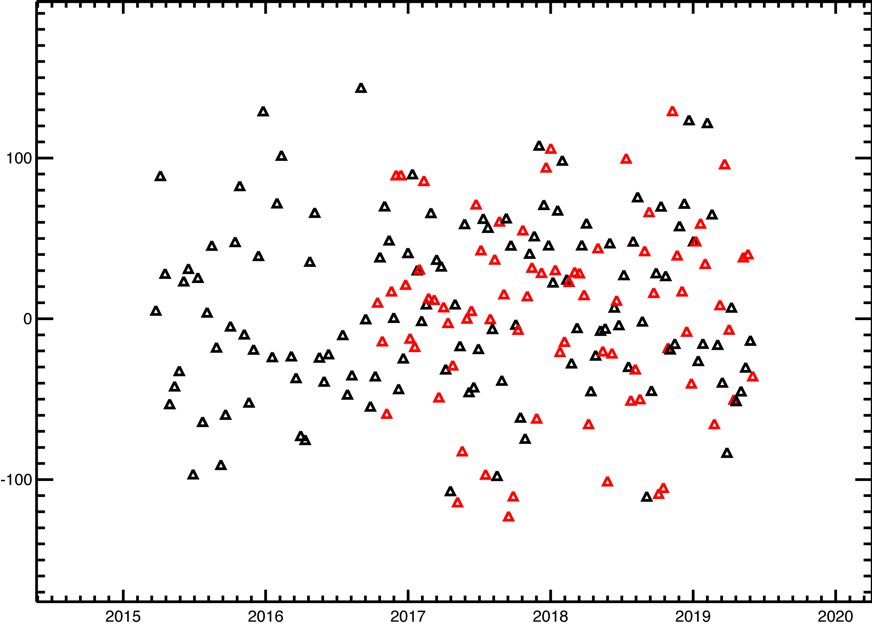
Figure description
2015 - 2020; -100 - 100.
Table 1 shows the main characteristics common to the two S-1 datasets used, while Table 2 shows the details of each dataset (number of acquisitions and interferograms considered and the corresponding time intervals).
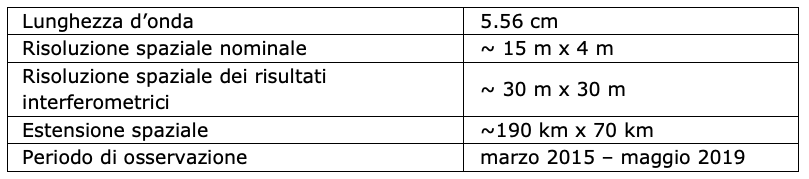
| Lunghezza d’onda | 5.56 cm |
|---|---|
| Risoluzione spaziale nominale | ~ 15 m x 4 m |
| Risoluzione spaziale dei risultati interferometrici | ~ 30 m x 30 m |
| Estensione spaziale | ~190 km x 70 km |
| Periodo di osservazione | marzo 2015 – maggio 2019 |

| Periodo di osservazione | Numero di acquisizioni utilizzate | Numero di interferogrammi | |
|---|---|---|---|
| Discendente | 22/03/2015-30/05/2019 | 191 | 528 |
| Ascendente | 23/03/2015-31/05/2019 | 200 | 553 |