


DInSAR Analysis - Period 1993-2010
A first interferometric analysis was conducted using the entire available archive of ERS-1/2 and ENVISAT data acquired in the area of interest from both descending and ascending orbits during the period 1993-2010.
In particular, 141 ERS-1/2 and ENVISAT data for descending orbits and 76 ERS-1/2 and ENVISAT data for ascending orbits were jointly processed. With these data, 412 and 213 differential interferograms were generated from ERS-1/2 and ENVISAT, respectively, characterized by space baseline values of less than 400 m. From these interferograms, the average ground deformation velocity maps and the corresponding time series of the displacements in the sensor line of sight (LOS) radar were obtained. In addition, by appropriately combining the deformation velocity maps from the descending and ascending orbits, the average deformation velocity maps of the vertical and east-west components of the displacement were generated.
For the generation of the interferograms, the SRTM DEM of the area with a spacing of approximately 30 m (1 arcsec) was used. Note that both the differential interferograms and the subsequent deformation maps and time series were obtained with a spatial resolution of approximately 80 m x 80 m, but after processing, they were resampled to the spacing of the DEM used; this makes the results obtained directly comparable with those of the subsequent Sentinel-1 analysis. It should be underlined that all the results shown refer to the common area of the analysis carried out on the data acquired from the descending and ascending orbits.
SBAS ERS-1/2 and ENVISAT analysis: descending orbit
For the interferometric analysis presented in this section, 141 satellite data acquired from descending orbits (track 208) in the period May 1993 - September 2010 were used. Through these data, 412 differential interferograms were generated, characterized by space baseline values of less than 400 m. Both the differential interferograms and the subsequent maps and time series of deformation were produced with a spatial resolution of approximately 80 m x 80 m, obtained through a spatial averaging operation (multi-looking), but, as mentioned above, they were resampled with a spacing of approximately 30 m to be superimposed on the DEM used.
Figure 1 shows (in false colours) the map of the average surface deformation velocity (in line of sight (LOS) of the radar sensor) superimposed on an optical image of the area of interest; the areas where the deformation measurement is affected by noise (decorrelation) are excluded from the map; the spatial reference against which the deformation measurements were calculated is located near the town of Pavia, indicated in Figure 1 with a small black square (REF).
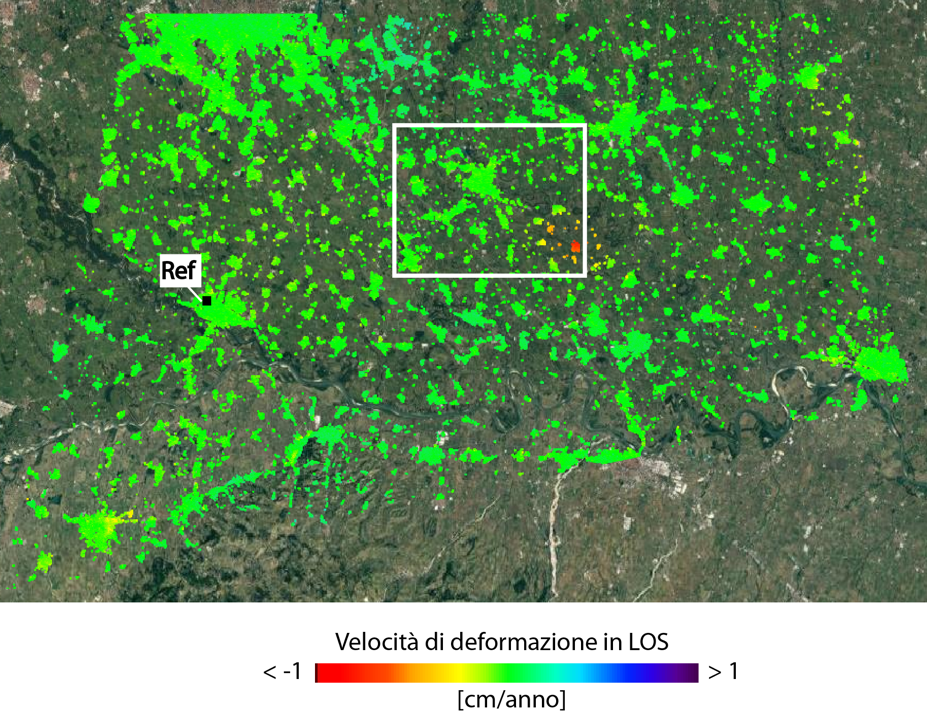
Figure 1 - Map of the strain rate along the LOS, geocoded and expressed in cm/year, superimposed on an optical image of the analysed area. The small black square indicates the spatial reference against which the strain measurements were calculated and is located near the centre of Pavia. The image refers to the processing of ERS-1/2 and ENVISAT data acquired from descending orbits in the period 1993-2010.
Figure 2 shows an enlargement of the area represented by the white rectangle in Figure 1, which includes the area of interest.
Several graphs also show the temporal trends of the surface shift along the LOS for two points located west of Cornegliano Laudense (P1 and P2 in Figure 2) and two points located in the Turano Lodigiano area (P3 and P4 in Figure 2). From the analysis carried out, there are no significant displacements (greater than 2 - 3 mm/year) in the area of interest with the exception of very localized deformations and a significant deformation effect present in the Turano Lodigiano area, which shows a substantially linear deformation trend with a rate of approximately 1 cm/year, whose origin cannot be attributed to the activities of the Cornegliano Stoccaggio.
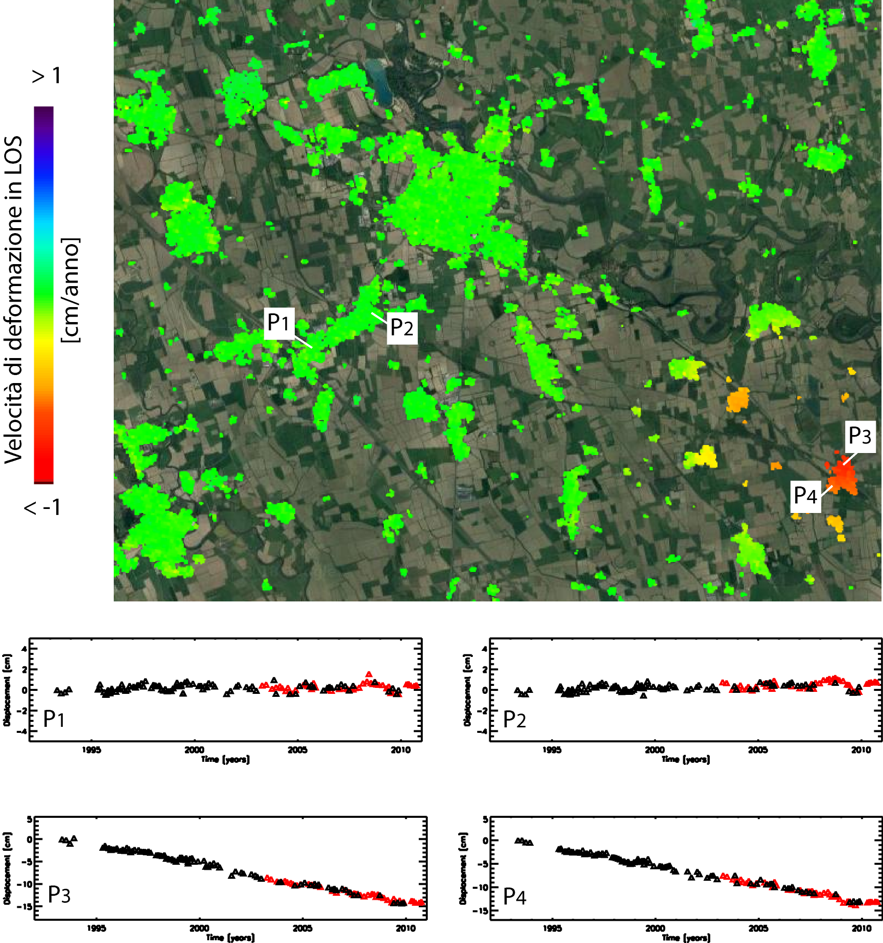
Figure 2 – Enlarged view of the average deformation rate map of Figure 1 corresponding to the white box, centred on the area that includes the municipalities of Cornegliano Laudense and Turano Lodigiano. The graphs show the temporal trends of the surface displacements along the LOS for two points located west of Cornegliano Laudense (P1 and P2) and two points located in the area of Turano Lodigiano (P3 and P4). The image refers to the processing of ENVISAT data acquired from descending orbits in the period 1993-2010. The black and red triangles represent the ERS and ENVISAT data, respectively.
SBAS ERS-1/2 and ENVISAT analysis: ascending orbit
For the interferometric analysis presented in this section, 76 satellite data (26 ERS-1/2 and 50 ENVISAT) acquired from ascending orbits (track 487) in the period June 1995 - October 2010 were used, whose distribution in the perpendicular time/baseline is shown in Figure 35, where the black and red rhombuses represent the ERS-1/2 and ENVISAT data, respectively. Through these data, 213 differential interferograms were generated, characterized by spatial baseline values less than 400 m.
Both the differential interferograms and the subsequent maps and time series of deformation were generated with a spatial resolution of approximately 80 m x 80 m, obtained through a multi-looking operation (complex spatial average) but were resampled after processing with a spacing of approximately 30 m to be superimposed on the DEM used.
It should be noted that the ERS-1/2 data acquired from ascending orbits are very few compared to those acquired from descending orbits; this insufficient time sampling makes it difficult to combine the line of sight (LOS) time series of the descending and ascending data to obtain time series of the vertical and east-west components of the deformation, as better specified in the next paragraph. Figure 3 shows the average surface strain velocity map along the LOS, superimposed on an optical image of the area of interest; the areas where the strain measurement is affected by decorrelation noise are excluded from the map; the spatial reference against which the strain measurements were calculated is located, also in this case, near the town of Pavia, indicated in Figure 3 with a small black square (REF).
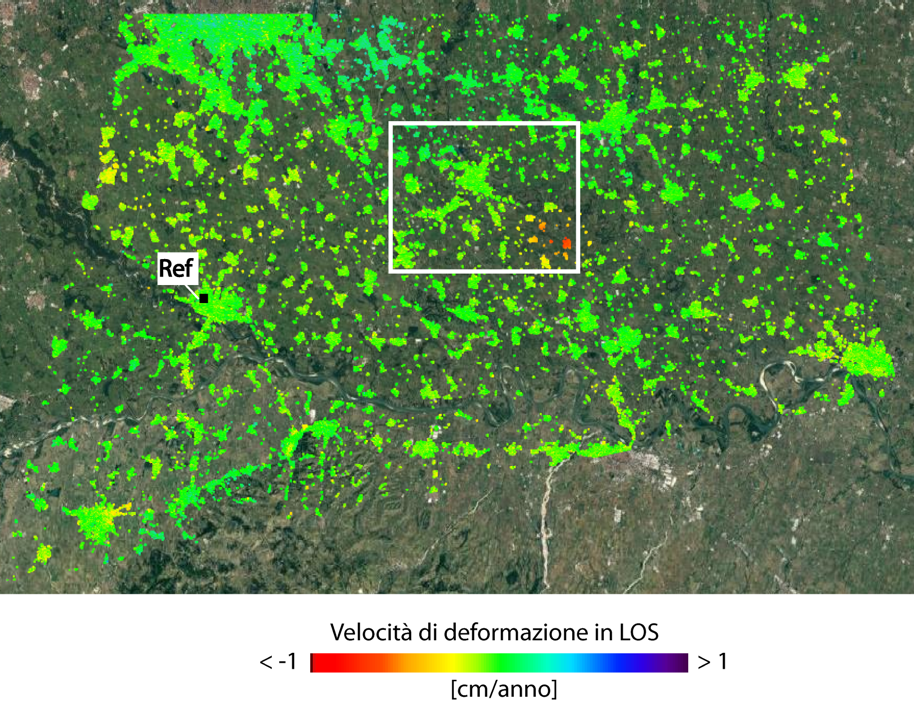
Figure 3 - Map of the strain rate along the LOS, geocoded and expressed in cm/year, superimposed on an optical image of the analysed area. The small black square indicates the spatial reference against which the strain measurements were calculated and is located near the centre of Pavia. The image refers to the processing of ERS-1/2 and ENVISAT data acquired from ascending orbits in the period 1995-2010.
Figure 4 shows an enlargement of the area represented by the white rectangle in Figure 3, which includes the area of interest.
Several graphs also show the temporal trends of the surface shifts along the LOS for two points located west of Cornegliano Laudense (P1 and P2 in Figure 4) and two points located in the Turano Lodigiano area (P3 and P4 in Figure 4).
Similar to the analysis of data acquired from descending orbits, in this case, there are no significant displacements in the area of interest with the exception of very localized deformations and a significant deformation effect present in the area of Turano Lodigiano, which shows a substantially linear deformation trend, with a rate of approximately 1 cm/year, whose origin cannot be attributed to the activities of the Cornegliano Stoccaggio facility.
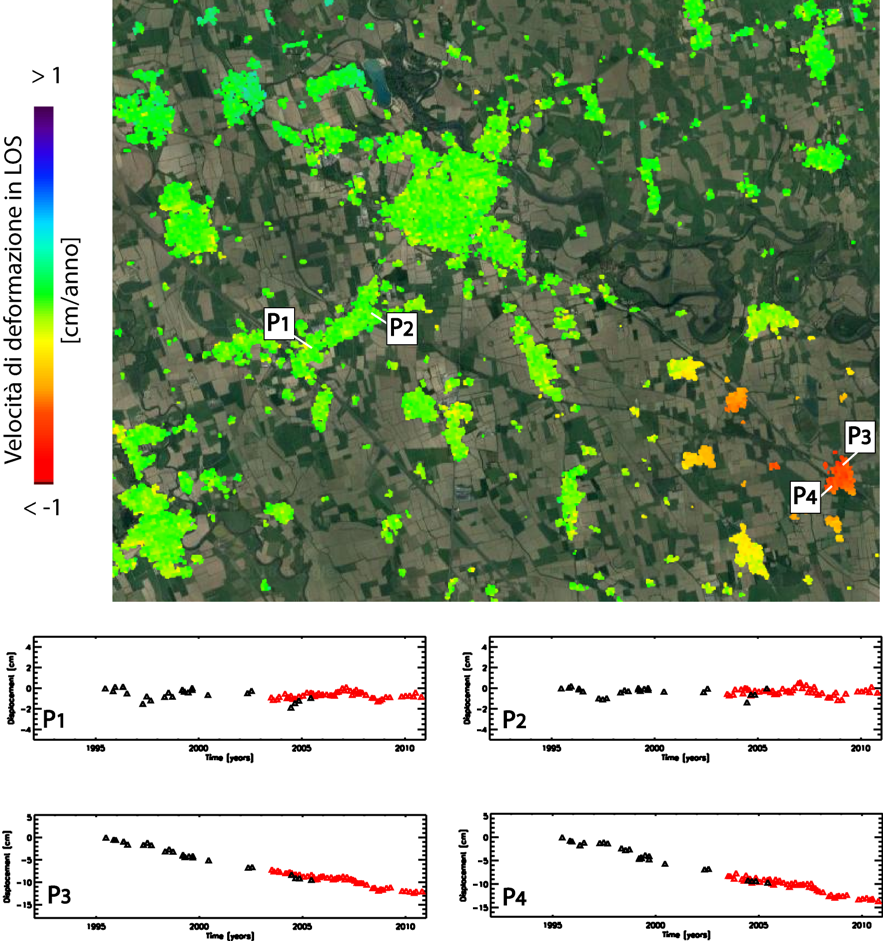
Figure 4 – Enlarged view of the average deformation rate map of Figure 1 corresponding to the white box, centred on the area that includes the municipalities of Cornegliano Laudense and Turano Lodigiano. The graphs show the temporal trends of the surface displacements along the LOS for two points located west of Cornegliano Laudense (P1 and P2) and two points located in the area of Turano Lodigiano (P3 and P4). The image refers to the processing of ENVISAT data acquired from ascending orbits in the period 1993-2010. The black and red triangles represent the ERS and ENVISAT data, respectively.
SBAS ERS-1/2 and ENVISAT analysis: vertical and east-west ground deformation components
By suitably combining the maps of average ground deformation velocity obtained from the descending (Figure 2) and ascending (Figure 4) SAR data presented in the previous sections, it was possible to generate the maps of the vertical and east-west components of the average surface deformation velocity relative to the area of interest, represented in Figures 5 and 6, respectively.
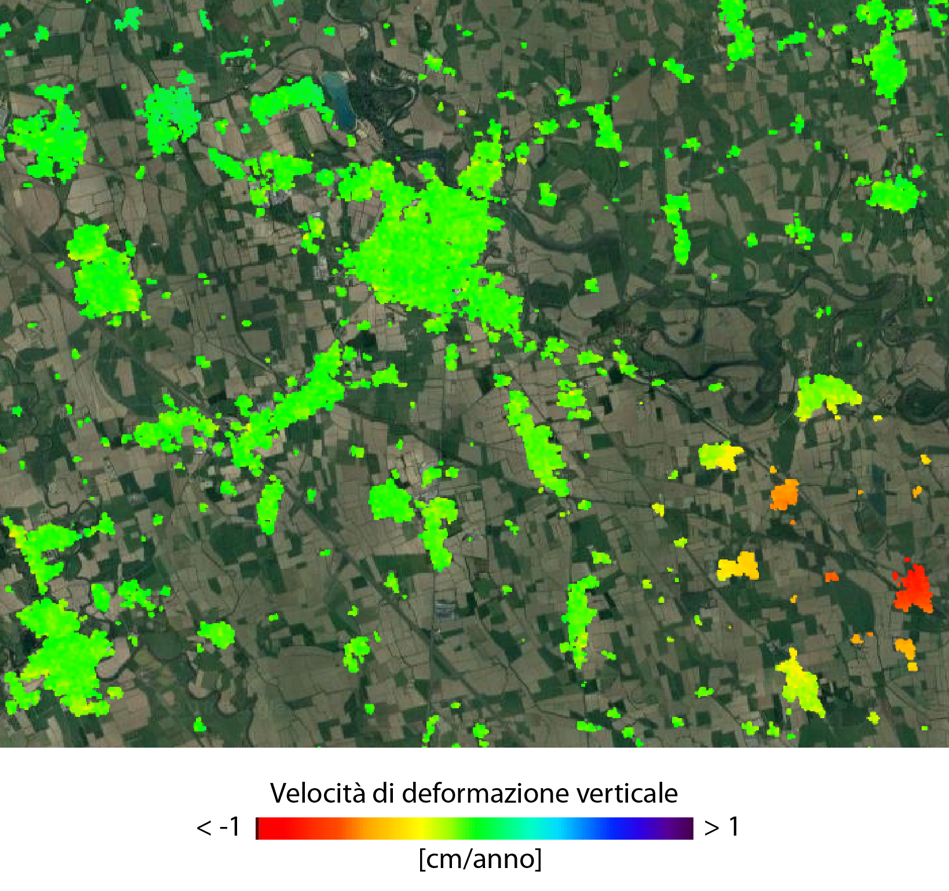
Figure 5 - Map of the average deformation velocity in the vertical component of the geocoded displacement and expressed in cm/year, relative to the area of interest, represented in Figures 2 and 4, which includes the municipalities of Cornegliano Laudense and Turano Lodigiano.
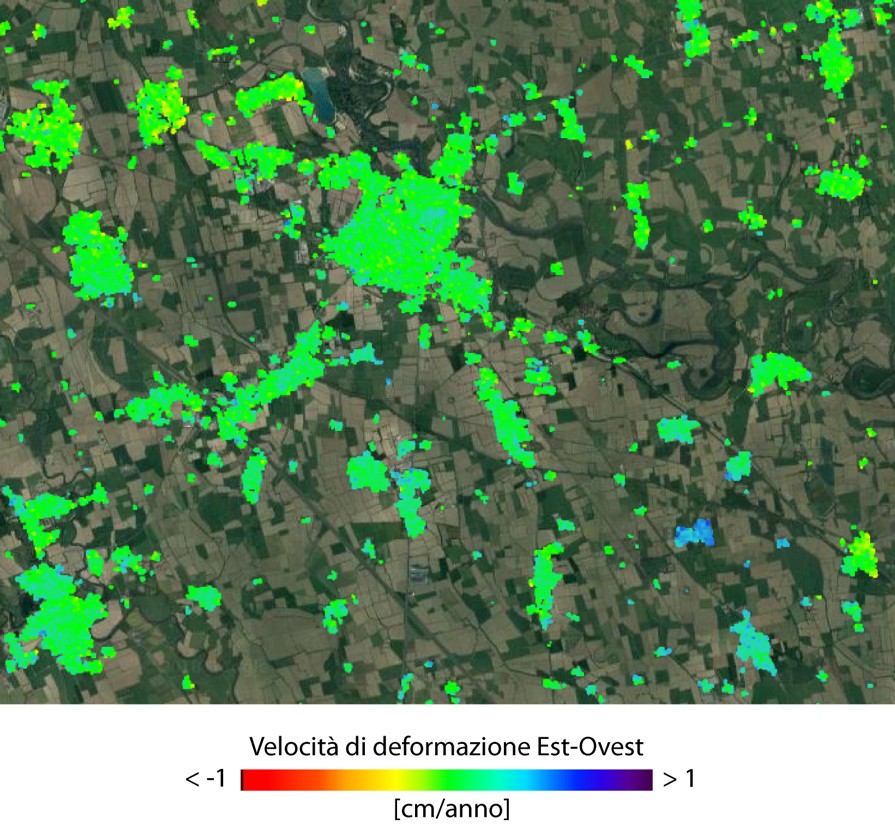
Figure 6 - Map of the average deformation velocity in the east-west component of the geocoded displacement and expressed in cm/year relative to the area of interest, represented in Figures 2 and 4, which includes the municipalities of Cornegliano Laudense and Turano Lodigiano.
As mentioned in the previous paragraph, however, the small size of the ascending ERS-1/2 dataset compared to that of the related descending dataset does not allow obtaining a temporal intersection between the acquisitions to generate satisfactory time series of the vertical and east-west components of the deformation; this process was instead applied to the analysis conducted with the Sentinel-1 data, which is presented in the next paragraph.
The analysis of the maps of the average deformation velocity relative to the vertical and east-west components of the displacement confirm what has already been detected by the elaborations of the acquisitions made by the single descending and ascending orbits. In fact, no significant displacements have been measured in the area of interest except for very localized deformations and a significant deformation effect in the Turano Lodigiano area, whose origin cannot be attributed to the activities of the Cornegliano Stoccaggio. In this area, the vertical component of the deformation is dominant (see Figure 5) and explains the observed deformation rates of approximately 1 cm/year, even though there is an area where the movements in the east-west direction are approximately 0.5 cm/year.