


Flow and pressure values
The graphs below represent the average data about gas storage activity with hourly sampling. The two figures represent the average pressure (units in bar) measured at the well collector and the flow rate (units in standard cubic metres per hour) during periods of plant activity. The graphs are updated every six months. The data are provided by IGS.
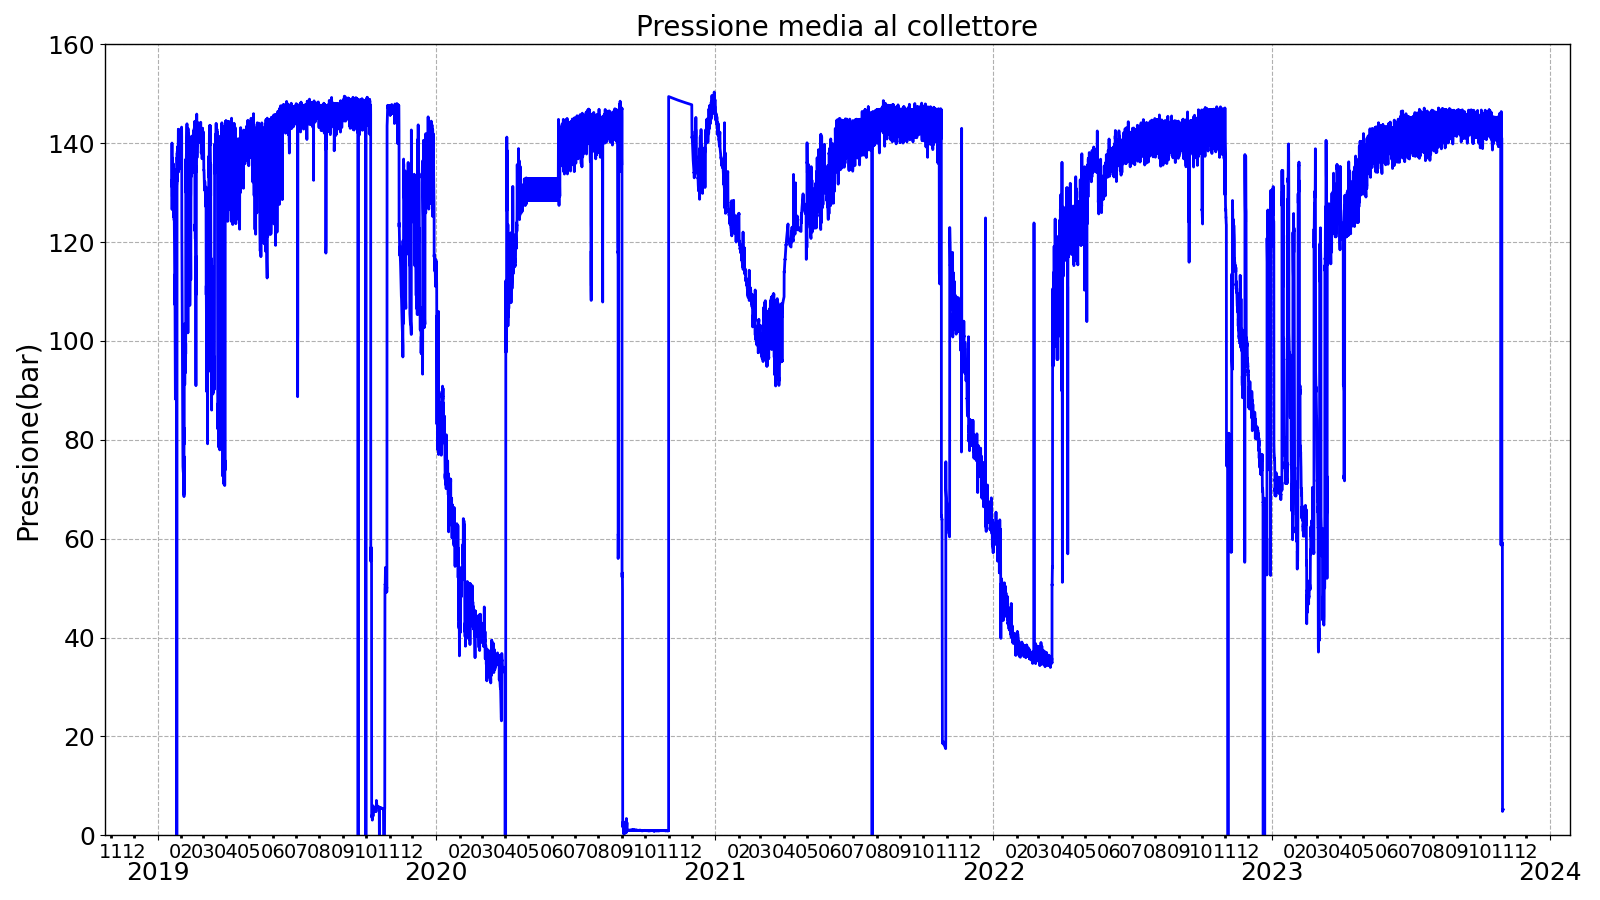
Figure 1 - Average pressure measured at the well collector during the periods of plant activity at the Cornegliano Laudense site. Units in bar.
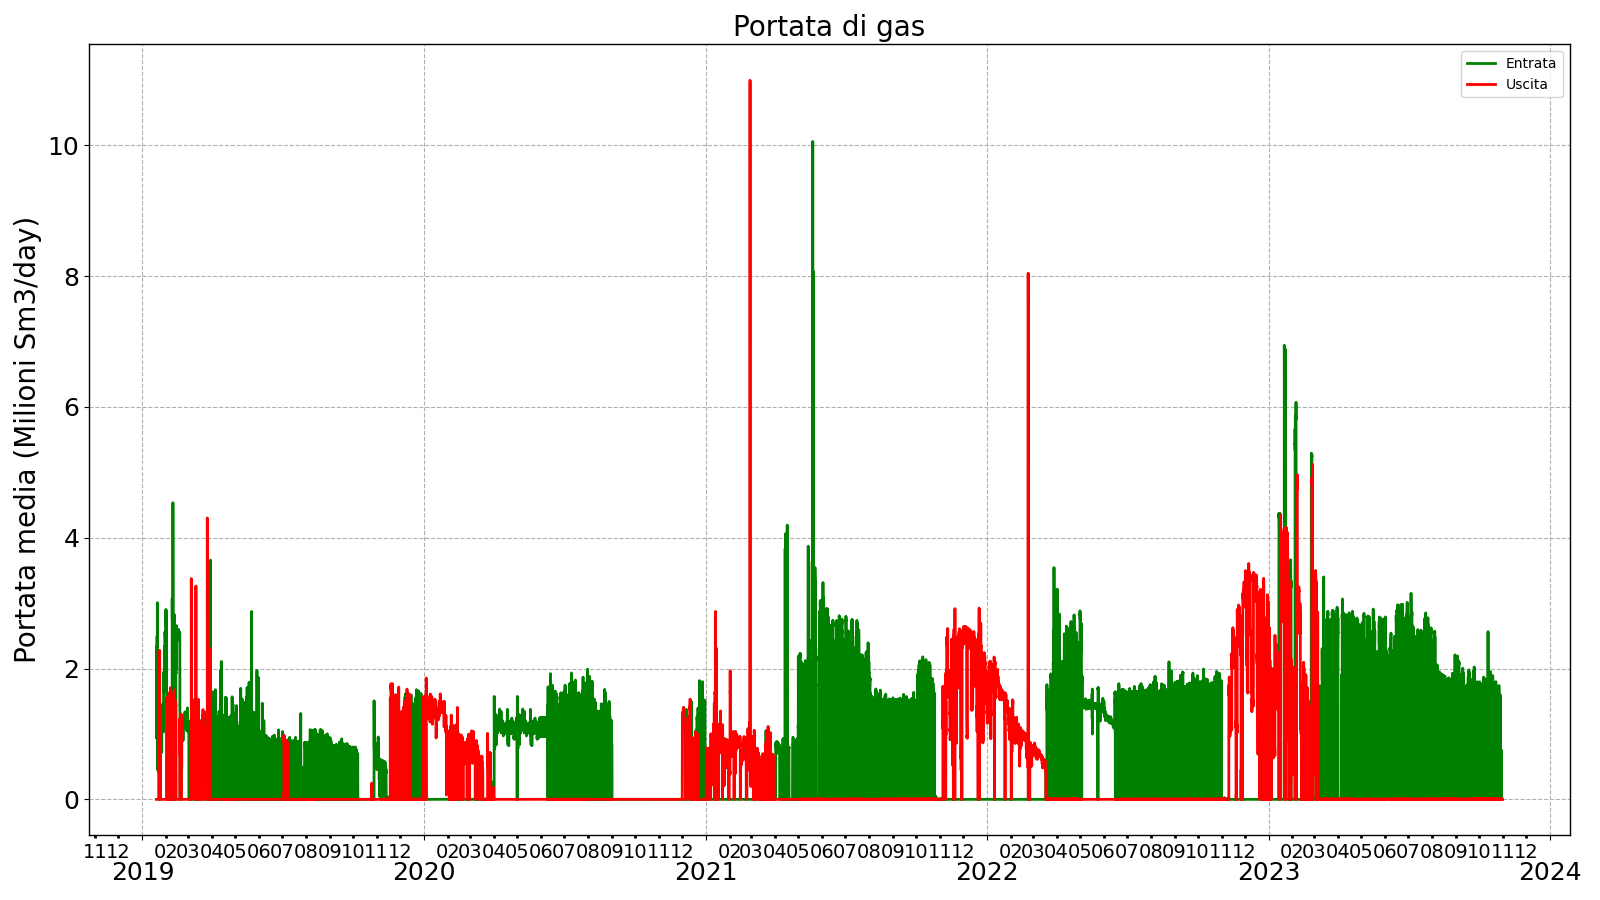
Figure 2 - Gas flow rate (units in standard cubic metres per hour) during plant activities.