


DInSAR Analysis - Period 2015-today
The interferometric analysis using the SBAS-DInSAR technique was carried out using Sentinel-1 (S-1) data for the area of interest and corresponding to 200 images acquired along ascending orbits and 191 along descending orbits for the period March 2015 - May 2019. With these data, 553 and 528 differential interferograms, respectively, were generated, characterized by perpendicular baseline values of less than 200 m. From these interferograms, maps of the mean ground deformation velocity and corresponding time series of deformation were obtained.
For the generation of the interferograms, the SRTM DEM of the area with a spacing of approximately 30 m (1 arcsec) was used. Both the differential interferograms and the subsequent deformation maps and time series had a spatial resolution of approximately 30 m x 30 m, obtained after a multi-looking operation and were sampled on the same grid as the DEM used for the processing. The spatial extent of the analysed area was approximately 190 km x 70 km. Since, unlike the maps and time series of deformation obtained from ERS-1/2 and ENVISAT data, DInSAR products generated from S-1 data have not yet received an extended validation (also due to the still short time span of the acquired series), SBAS results were validated through comparisons between DInSAR displacement measurements and the corresponding GPS measurements obtained from the MAGNET database (http://geodesy.unr.edu/magnet.php). It should be underlined, however, that in the analyses of the coming years, the GPS results obtained by OGS will be used, as soon as the time series produced are sufficiently long.
For both ascending and descending processing, a pixel in the urban area of Pavia near the corresponding GPS station was chosen as the reference point (also called the docking point), which, as evidenced by the related GPS measurements, was not affected by deformation. It should also be noted that by suitably combining the results obtained from the S-1 data acquired from the ascending and descending orbits, both the maps and the time series of deformation of the vertical and east-west components of the detected displacements were generated.
The following sections describe in detail the results of the interferometric analysis carried out using the descending and ascending data and those related to their combination.
Note that all the results shown refer to the common area and pixels common to the analysis carried out on the data acquired from the descending and ascending orbits by the Sentinel-1A (S-1A) and Sentinel-1B (S-1B) satellites that make up the constellation.
SBAS Sentinel-1 analysis: descending orbit
The interferometric analysis in the area of interest was performed using SAR data acquired from constellation S-1 along descending orbits (track 168). In particular, 191 satellite data acquired in the period March 2015 - May 2019 were used, with which 528 differential interferograms were generated, characterized by perpendicular baseline values of less than 200 m. From these interferograms, the average ground deformation velocity maps and the corresponding time series of deformation were obtained.
The results of the interferometric analysis performed are presented in Figure 1, where the geocoded map of the mean deformation velocity is shown, projected along the line of sight (LOS) of the sensor and superimposed on an optical image of the analysed area; the points affected by decorrelation noise, for which the strain measurement cannot be considered reliable, are not shown. The generated SBAS-DInSAR time series were compared with the corresponding GPS strain series obtained from the MAGNET database. In particular, Figure 1 shows the positions of the six GPS stations considered (identified on the strain map by white stars), and for each of them, the comparison graphs between the projected GPS strain time series with respect to the radar sensor line of sight (red asterisks) and those obtained by DInSAR data (black triangles) are shown.
As seen from the graphs, the comparisons between the DInSAR measurements and the geodetic measurements show very good agreement; this is also evidenced by the values of the standard deviations of the differences between the two strain measurements, whose average value is less than 0.5 cm. This value is consistent with, if not better than, the estimated accuracy of the SBAS technique reported in the literature.
Figure 2 shows a magnification of the LOS strain map in Figure 1 in the area of interest. In addition, several graphs show the temporal trends of the surface displacements along the LOS for three points located west of Cornegliano Laudense (P1, P2 and P3 in Figure 2) and one point located in the area of Turano Lodigiano (P4 in Figure 2).
From the analysis carried out, no significant deformations (greater than 2-3 mm/year) were found in the Cornegliano Laudense area with the exception of very localized deformations and a significant deformation effect in the Turano Lodigiano area, which even in the S-1 analysis shows, in continuity with the historical analysis carried out using ERS-1/2 and ENVISAT data, a substantially linear deformation trend with a rate ranging from 0.5 cm/year to 1 cm/year, whose origin cannot be attributed to the activities of the Cornegliano Stoccaggio facility.
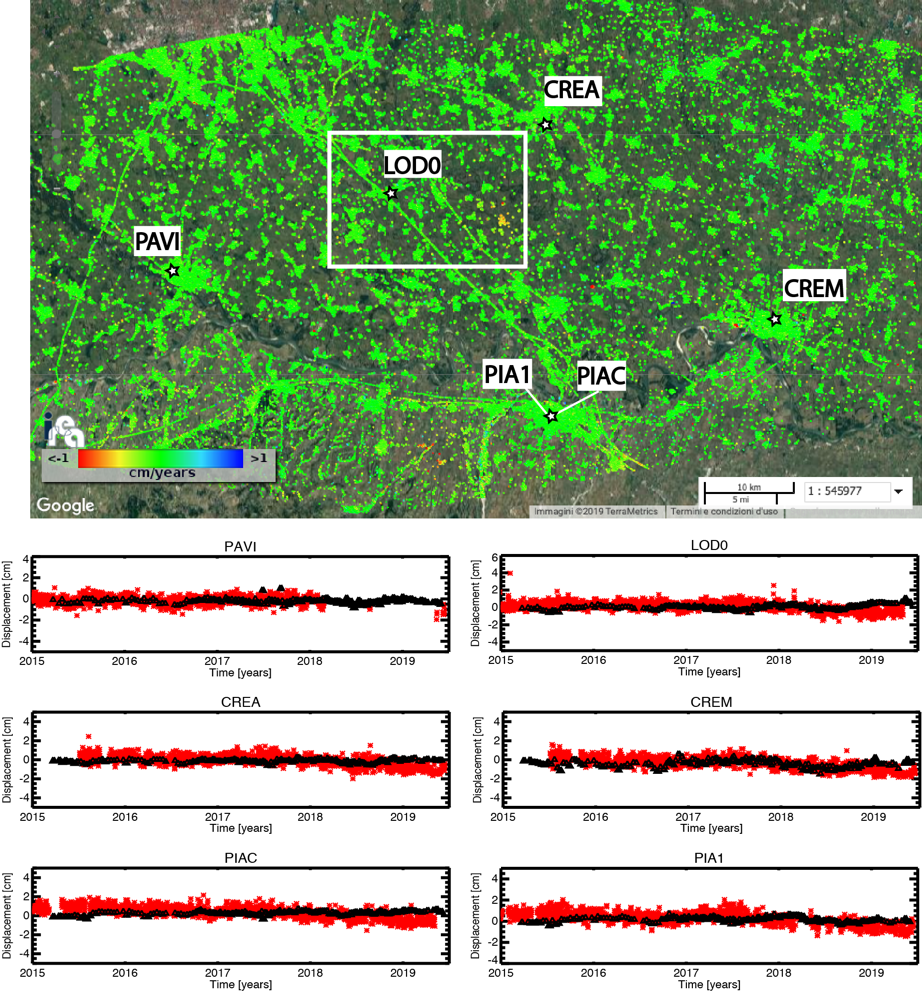
Figure 1 - LOS strain rate map, geocoded and expressed in cm/year, superimposed on an optical image of the area of interest. The image refers to the processing of S-1 data acquired from descending orbits in the period March 2015 - May 2019. In addition, the graphs of comparisons between the GPS time series of deformation projected in the radar sensor line of sight (red asterisks) and those obtained through DInSAR data (black triangles) are shown corresponding with the 6 GPS stations identified on the map by white stars. The white rectangle marks the area analysed in detail in Figure 2.
Figure 2 shows an enlargement of the area represented by the white rectangle in Figure 1, which includes the area of interest.
Several graphs also show the temporal trends of the surface shifts along the LOS for two points located west of Cornegliano Laudense (P1 and P2 in Figure 2) and two points located in the Turano Lodigiano area (P3 and P4 in Figure 2). From the analysis carried out, there are no significant displacements (greater than 2 - 3 mm/year) in the area of interest with the exception of very localized deformations and a significant deformation effect in the Turano Lodigiano area, which shows a substantially linear deformation trend with a rate of approximately 1 cm/year, which cannot be attributed to the activities of the Cornegliano Stoccaggio facility.
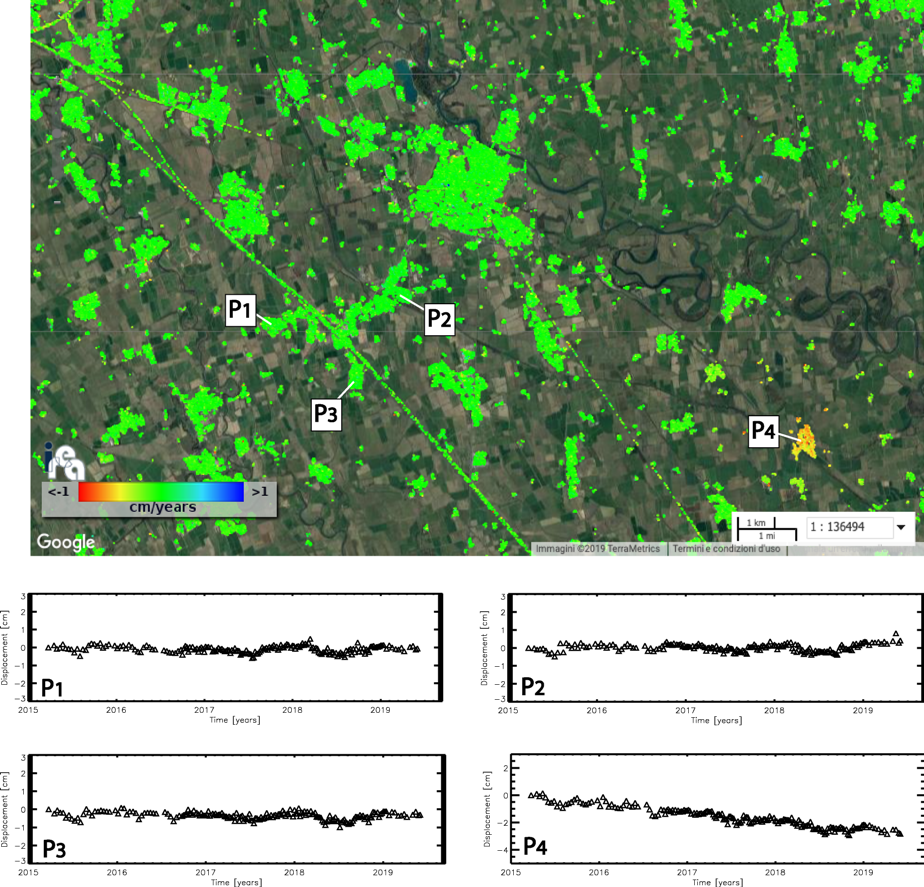
Figure 2 - Enlarged view of the average deformation rate map of Figure 1 corresponding to the area identified by the white rectangle, centred on the area that includes the municipalities of Cornegliano Laudense and Turano Lodigiano. The graphs show the temporal trends of the surface displacements along the LOS for three points located near Cornegliano Laudense (P1, P2 and P3) and one point located in the area of Turano Lodigiano (P4). The image refers to the processing of S-1 data acquired from descending orbits in the period March 2015 - May 2019.
SBAS Sentinel-1 analysis: ascending orbit
For the interferometric analysis conducted in the area of interest using SAR data acquired from constellation S-1 in the period March 2015 - May 2019 along ascending orbits (track 15), 200 satellite data were used, with which 553 differential interferograms were generated, characterized by perpendicular baseline values of less than 200 m. From these interferograms, the average ground deformation velocity maps and the corresponding time series of deformation were obtained.
The results of the interferometric analysis carried out are presented in Figure 3, where the geocoded LOS mean deformation velocity map superimposed on an optical image of the analysed area is shown; the points affected by decorrelation noise, for which the deformation measurement cannot be considered reliable, are not shown.
Similar to the process described in the previous paragraph, the DInSAR time series generated by the ascending orbits dataset were also compared with the corresponding GPS strain series obtained from the MAGNET database. In particular, Figure 3 shows the six GPS stations considered (identified on the deformation map by white stars) and, for each of them, the graphs of comparisons between the GPS deformation time series projected with respect to the line of sight of the radar sensor (red asterisks) and those obtained through DInSAR data (black triangles). As seen from the graphs, the comparisons between DInSAR and geodetic measurements show very good agreement, as also evidenced by the obtained values of the standard deviations of the differences between the two displacement measurements, whose average value is less than 0.5 cm. This standard deviation is consistent with the estimated accuracy of the SBAS technique reported in the literature. Figure 4 shows a magnification of the strain map in the LOS of Figure 3 in the area of interest.
Moreover, several graphs showing the temporal trends of the surface displacements along the LOS for three points located near Cornegliano Laudense (P1, P2 and P3 in Figure 4) and one point located in the area of Turano Lodigiano (P4 in Figure 4) are presented.
From the analysis carried out, no significant deformations (more than 2-3 mm/year) have been found in the Cornegliano Laudense area, with the exception of some very localized phenomena and a significant deformation effect in the Turano Lodigiano area, which even in the S-1 analysis shows a substantially linear deformation trend with a rate that varies from 0.5 cm/year to 1 cm/year, whose origin cannot be attributed to the activities of the Cornegliano Stoccaggio facility.
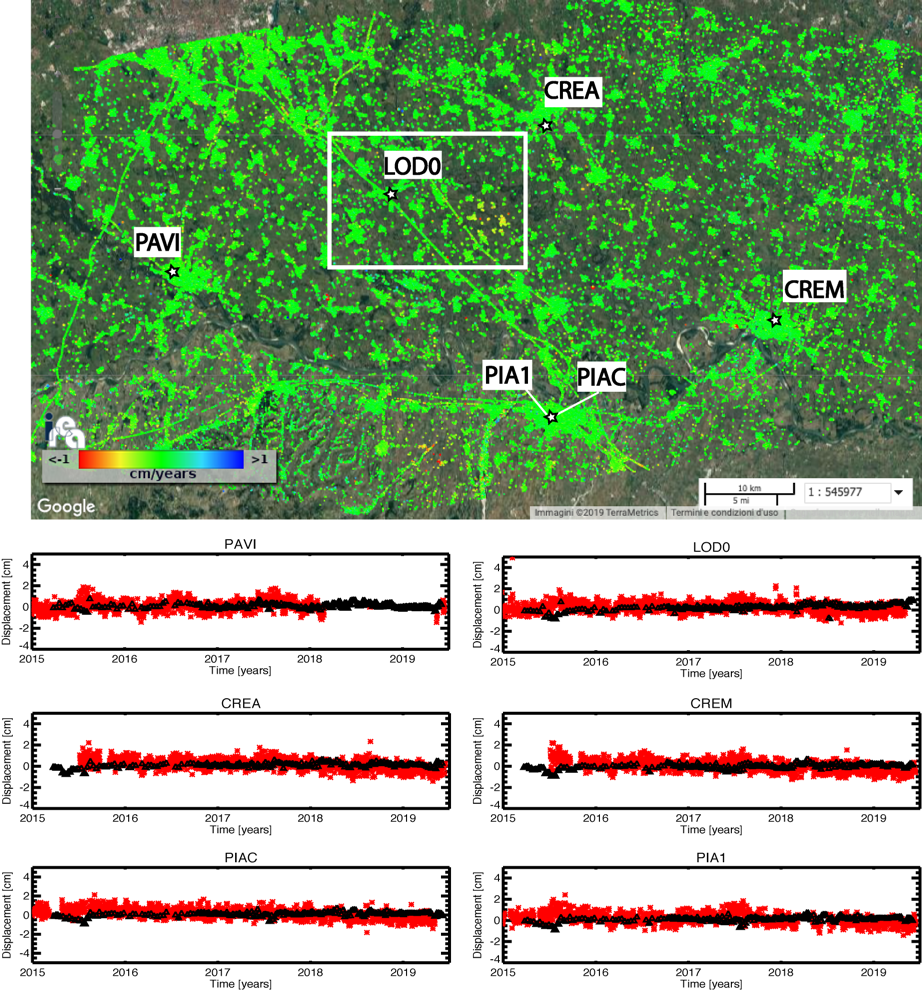
Figure 3 - LOS strain rate map, geocoded and expressed in cm/year, superimposed on an optical image of the area of interest. The image refers to the processing of S-1 data acquired from ascending orbits in the period March 2015 - May 2019. It also shows, in correspondence with the 6 GPS stations identified on the map by white stars, the graphs of the comparisons between the historical GPS deformation series projected along the line of sight of the radar sensor (red asterisks) and those obtained by DInSAR data (black triangles). The white rectangle marks the area analysed in detail in Figure 4.
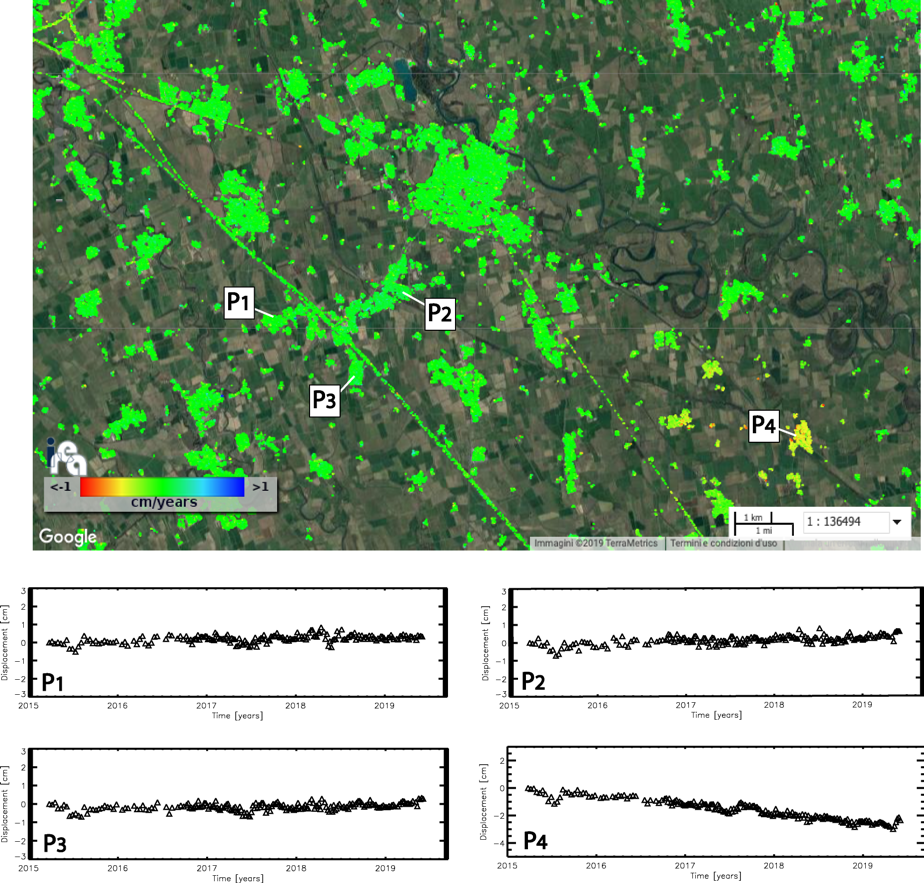
Figure 4 - Enlarged view of the average deformation rate map in Figure 3 corresponding to the area identified by the white rectangle, centred on the area that includes the municipalities of Cornegliano Laudense and Turano Lodigiano. The graphs show the temporal trends of the surface displacements along the LOS for three points located near Cornegliano Laudense (P1, P2 and P3) and one point located in the area of Turano Lodigiano (P4). The image refers to the processing of S-1 data acquired from ascending orbits in the period March 2015 - May 2019.
SBAS Sentinel-1 analysis: vertical and east-west ground deformation components
The average velocity maps related to the vertical and east-west components of the detected deformations, obtained by suitably combining the information generated from the ascending and descending orbit analyses, are shown in Figures 5 and 6, respectively. Additionally, in this case, using the measurements of the six GPS stations from the MAGNET database, as indicated on the maps, comparisons were made between the GPS deformation series and those obtained using DInSAR data (red asterisks and black triangles, respectively). In particular, Figure 5 shows the graphs of the comparisons made for the vertical component of the deformation; the standard deviations of the differences between the two displacement measurements have an average value of approximately 0.4 cm. Similarly, in Figure 6, the graphs of the comparisons made for the east-west component of the deformation are shown; in this case, the standard deviations of the differences between the two displacement measurements have an average value of less than 0.3 cm.
This analysis shows that in both cases, the comparisons between DInSAR and geodetic measurements show very good agreement, and the standard deviation values are consistent with the accuracy of the SBAS technique reported in the literature.
Figures 7 and 8 show the maps of the average deformation velocity relative to the vertical and east-west displacement components, respectively, and represent magnifications of the areas identified by the white rectangles in Figures 5 and 6. Additionally, graphs relative to the time trends of the deformations of four selected points are represented. The analysis of the results shown in Figures 7 and 8 also indicates that in the period 2015-2019, there were no significant deformations in the Cornegliano Laudense area (see the plots of points P1, P2, and P3) with the exception of very localized displacements and a significant deformation effect in the Turano Lodigiano area, which also shows, in the S-1 analysis, a significant vertical component (see the plot of point P4) with a rate whose maximum value is approximately 1 cm/year, whose origin cannot be attributed to the activities of the Cornegliano Stoccaggio facility.
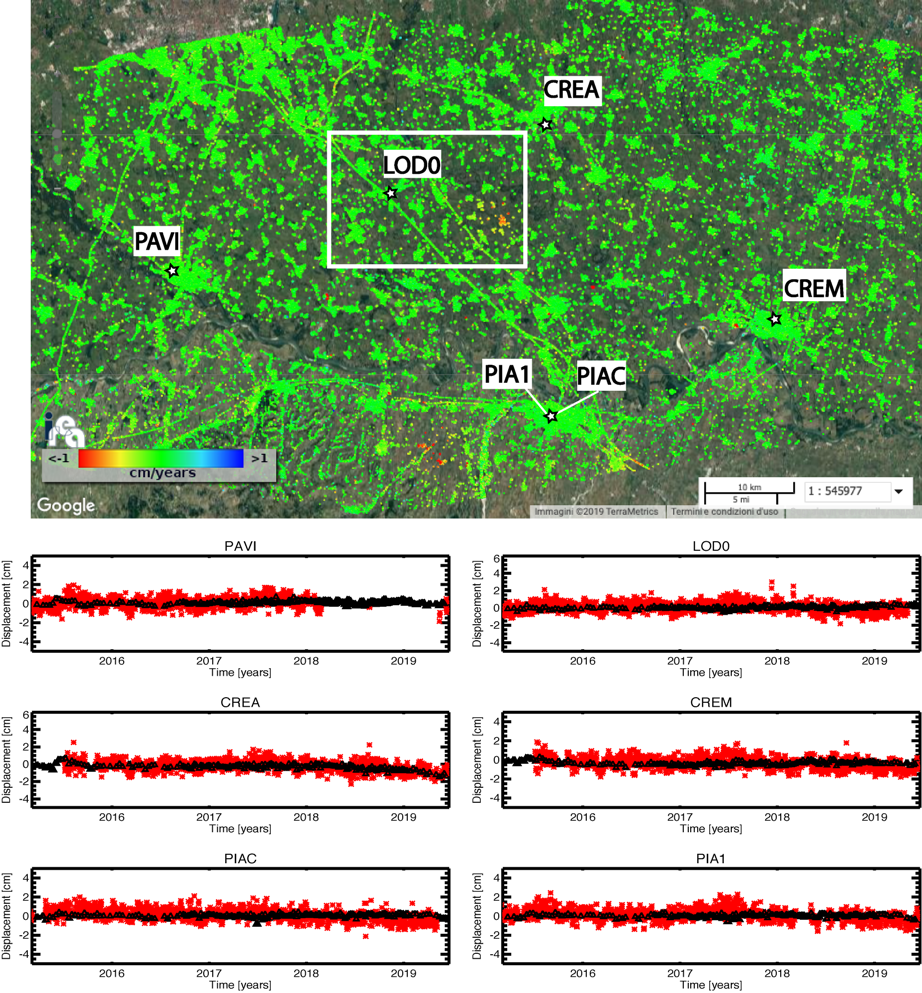
Figure 5 - Map of the vertical component of the deformation velocity, geocoded and expressed in cm/year, superimposed on an optical image of the area of interest. In addition, graphs of the comparisons between the vertical component of the GPS deformation history series (red asterisks) and the one obtained with DInSAR data (black triangles) are shown in correspondence with the 6 GPS stations identified on the map by white stars.
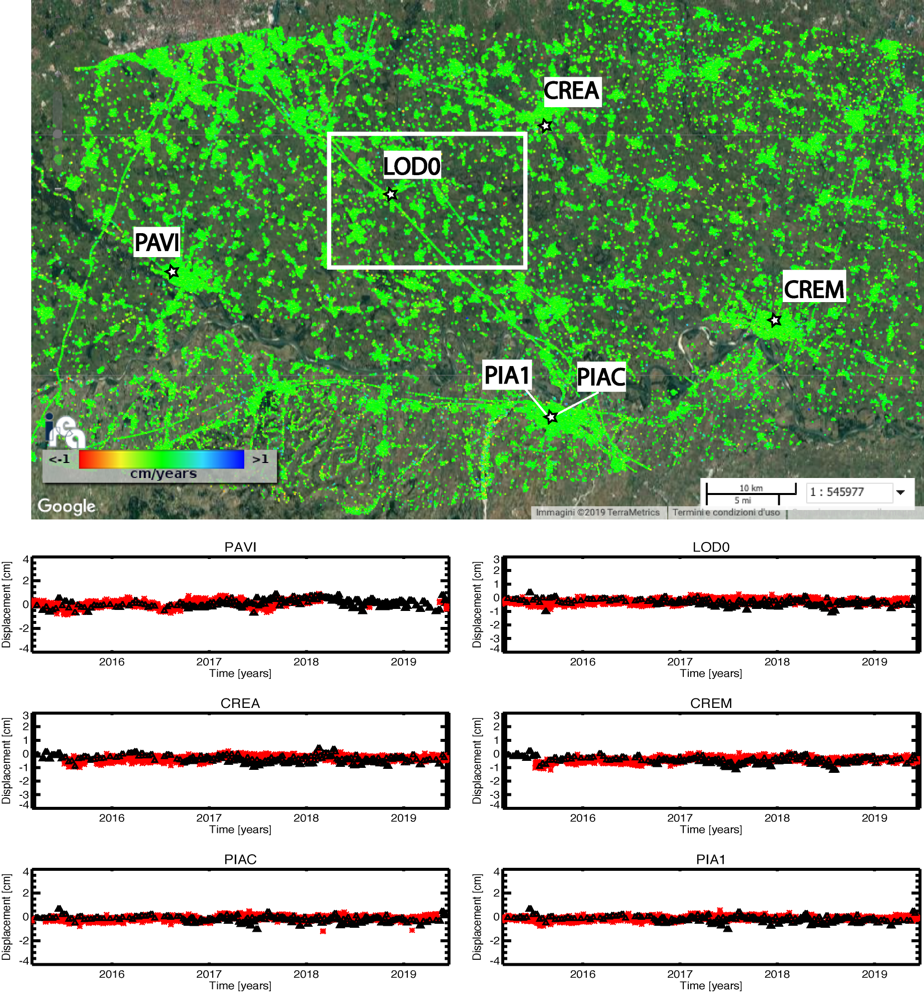
Figure 6 - Map of the east-west component of the deformation velocity, geocoded and expressed in cm/year, superimposed on an optical image of the area of interest. In addition, graphs of the comparisons between the historical series of GPS deformation in the east-west direction (red asterisks) and those obtained with DInSAR data (black triangles) are shown in correspondence with the 6 GPS stations identified on the map by white stars.