


DInSAR data - Period 2015-today
The interferometric analysis for the period March 2015 - May 2019 was performed using the SBAS-DInSAR technique using Sentinel-1 (S-1) data for the area of interest and corresponding to 200 images acquired along ascending orbits and 191 along descending orbits.
Figure 1 shows the distribution of S-1 data in the time/baseline-perpendicular plane.
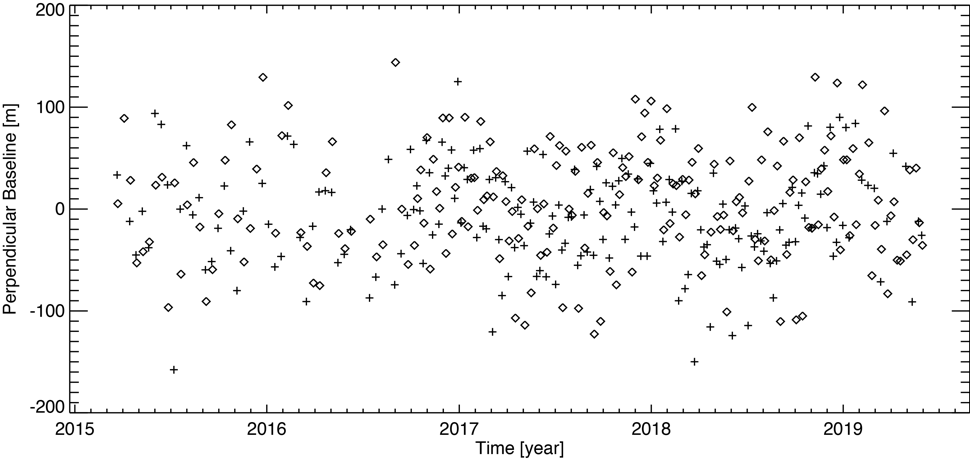
Figure 1 - Distribution in the time/baseline-perpendicular plane of S-1 SAR data acquired in the area of interest. Each tick represents one SAR image acquired from descending orbits, and each rhombus is a SAR image obtained from ascending orbits.
Figure 2 and Figure 3 show the S-1 data distributions in the time/baseline-perpendicular plane acquired from descending and ascending orbits, respectively. The black and red triangles represent the S-1A and S-1B data.
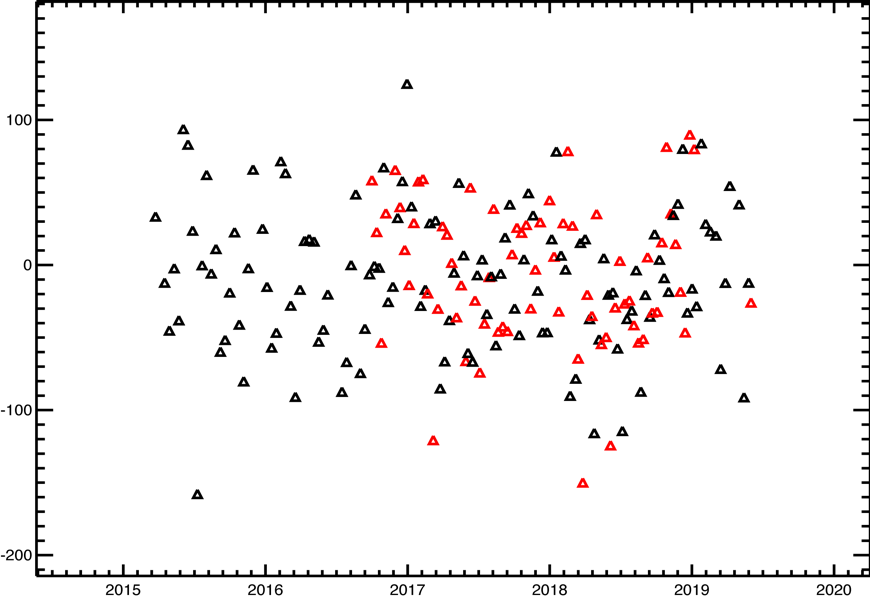
Figure 2 - Distribution in the time/baseline-perpendicular plane of S-1 SAR data acquired from descending orbits over the area of interest. The black and red triangles represent the S-1A and S-1B data, respectively.
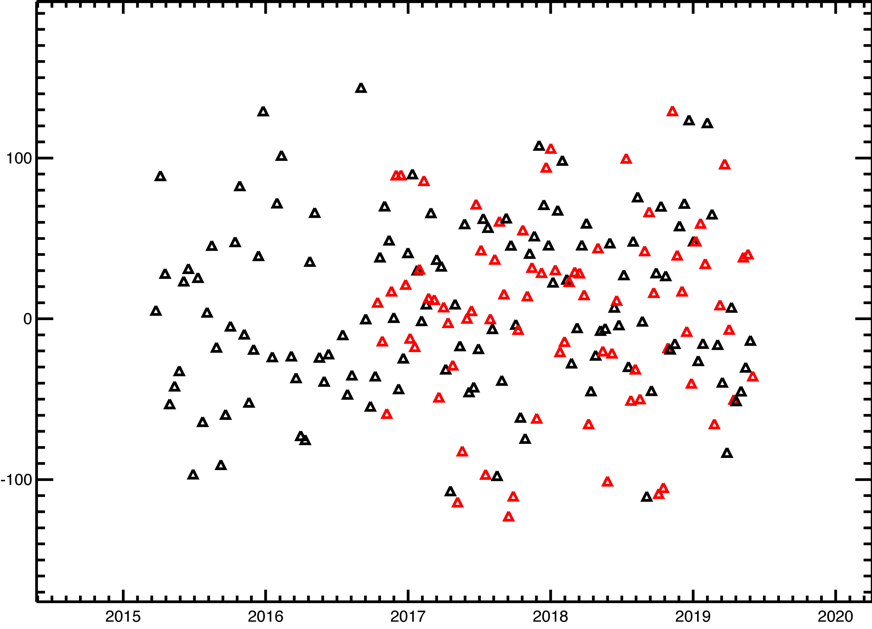
Figure 3 - Distribution in the time/baseline-perpendicular plane of S-1 SAR data acquired from ascending orbits over the area of interest. The black and red triangles represent the S-1A and S-1B data, respectively.
Table 1 shows the main characteristics common to the two S-1 datasets used, while Table 2 shows the details of each dataset (number of acquisitions and interferograms considered and the corresponding time intervals).
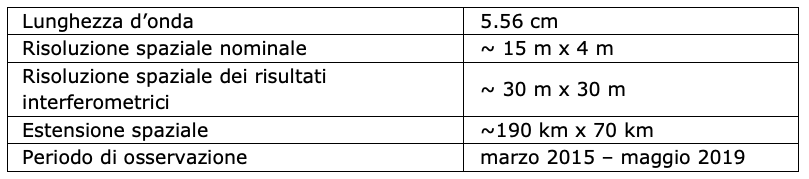
Table 1 - Main characteristics common to the two S-1 SAR datasets used.
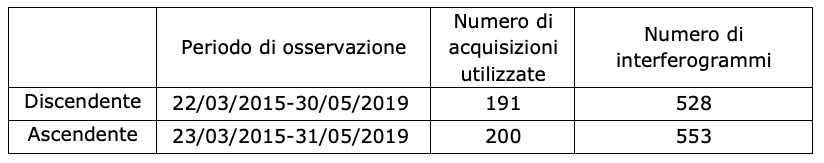
Table 2 - Main features related to each of the two S-1 SAR datasets used.