


Seismological analysis procedures
For the detection of seismicity of interest in the Cornegliano Laudense reservoir area, two reference areas have been identified, which correspond to the detection domains indicated in the Monitoring Guidelines of the Ministry for Economic Development. The Internal Domain (DI) surrounds the reservoir up to a distance of 3 km and the Extended Domain (DE) extends up to 15 km from the external perimeter of the reservoir. In addition to the two domains defined by the ILGs, a further domain, called the Outer Domain, has been added with a width of 30 km from the centre of the reservoir and is conventionally referred to as the Outer Area (AE). The areas corresponding on the surface to the two domains are shown with red lines in Figure 1, and with the black dashed line for the Outer Area.
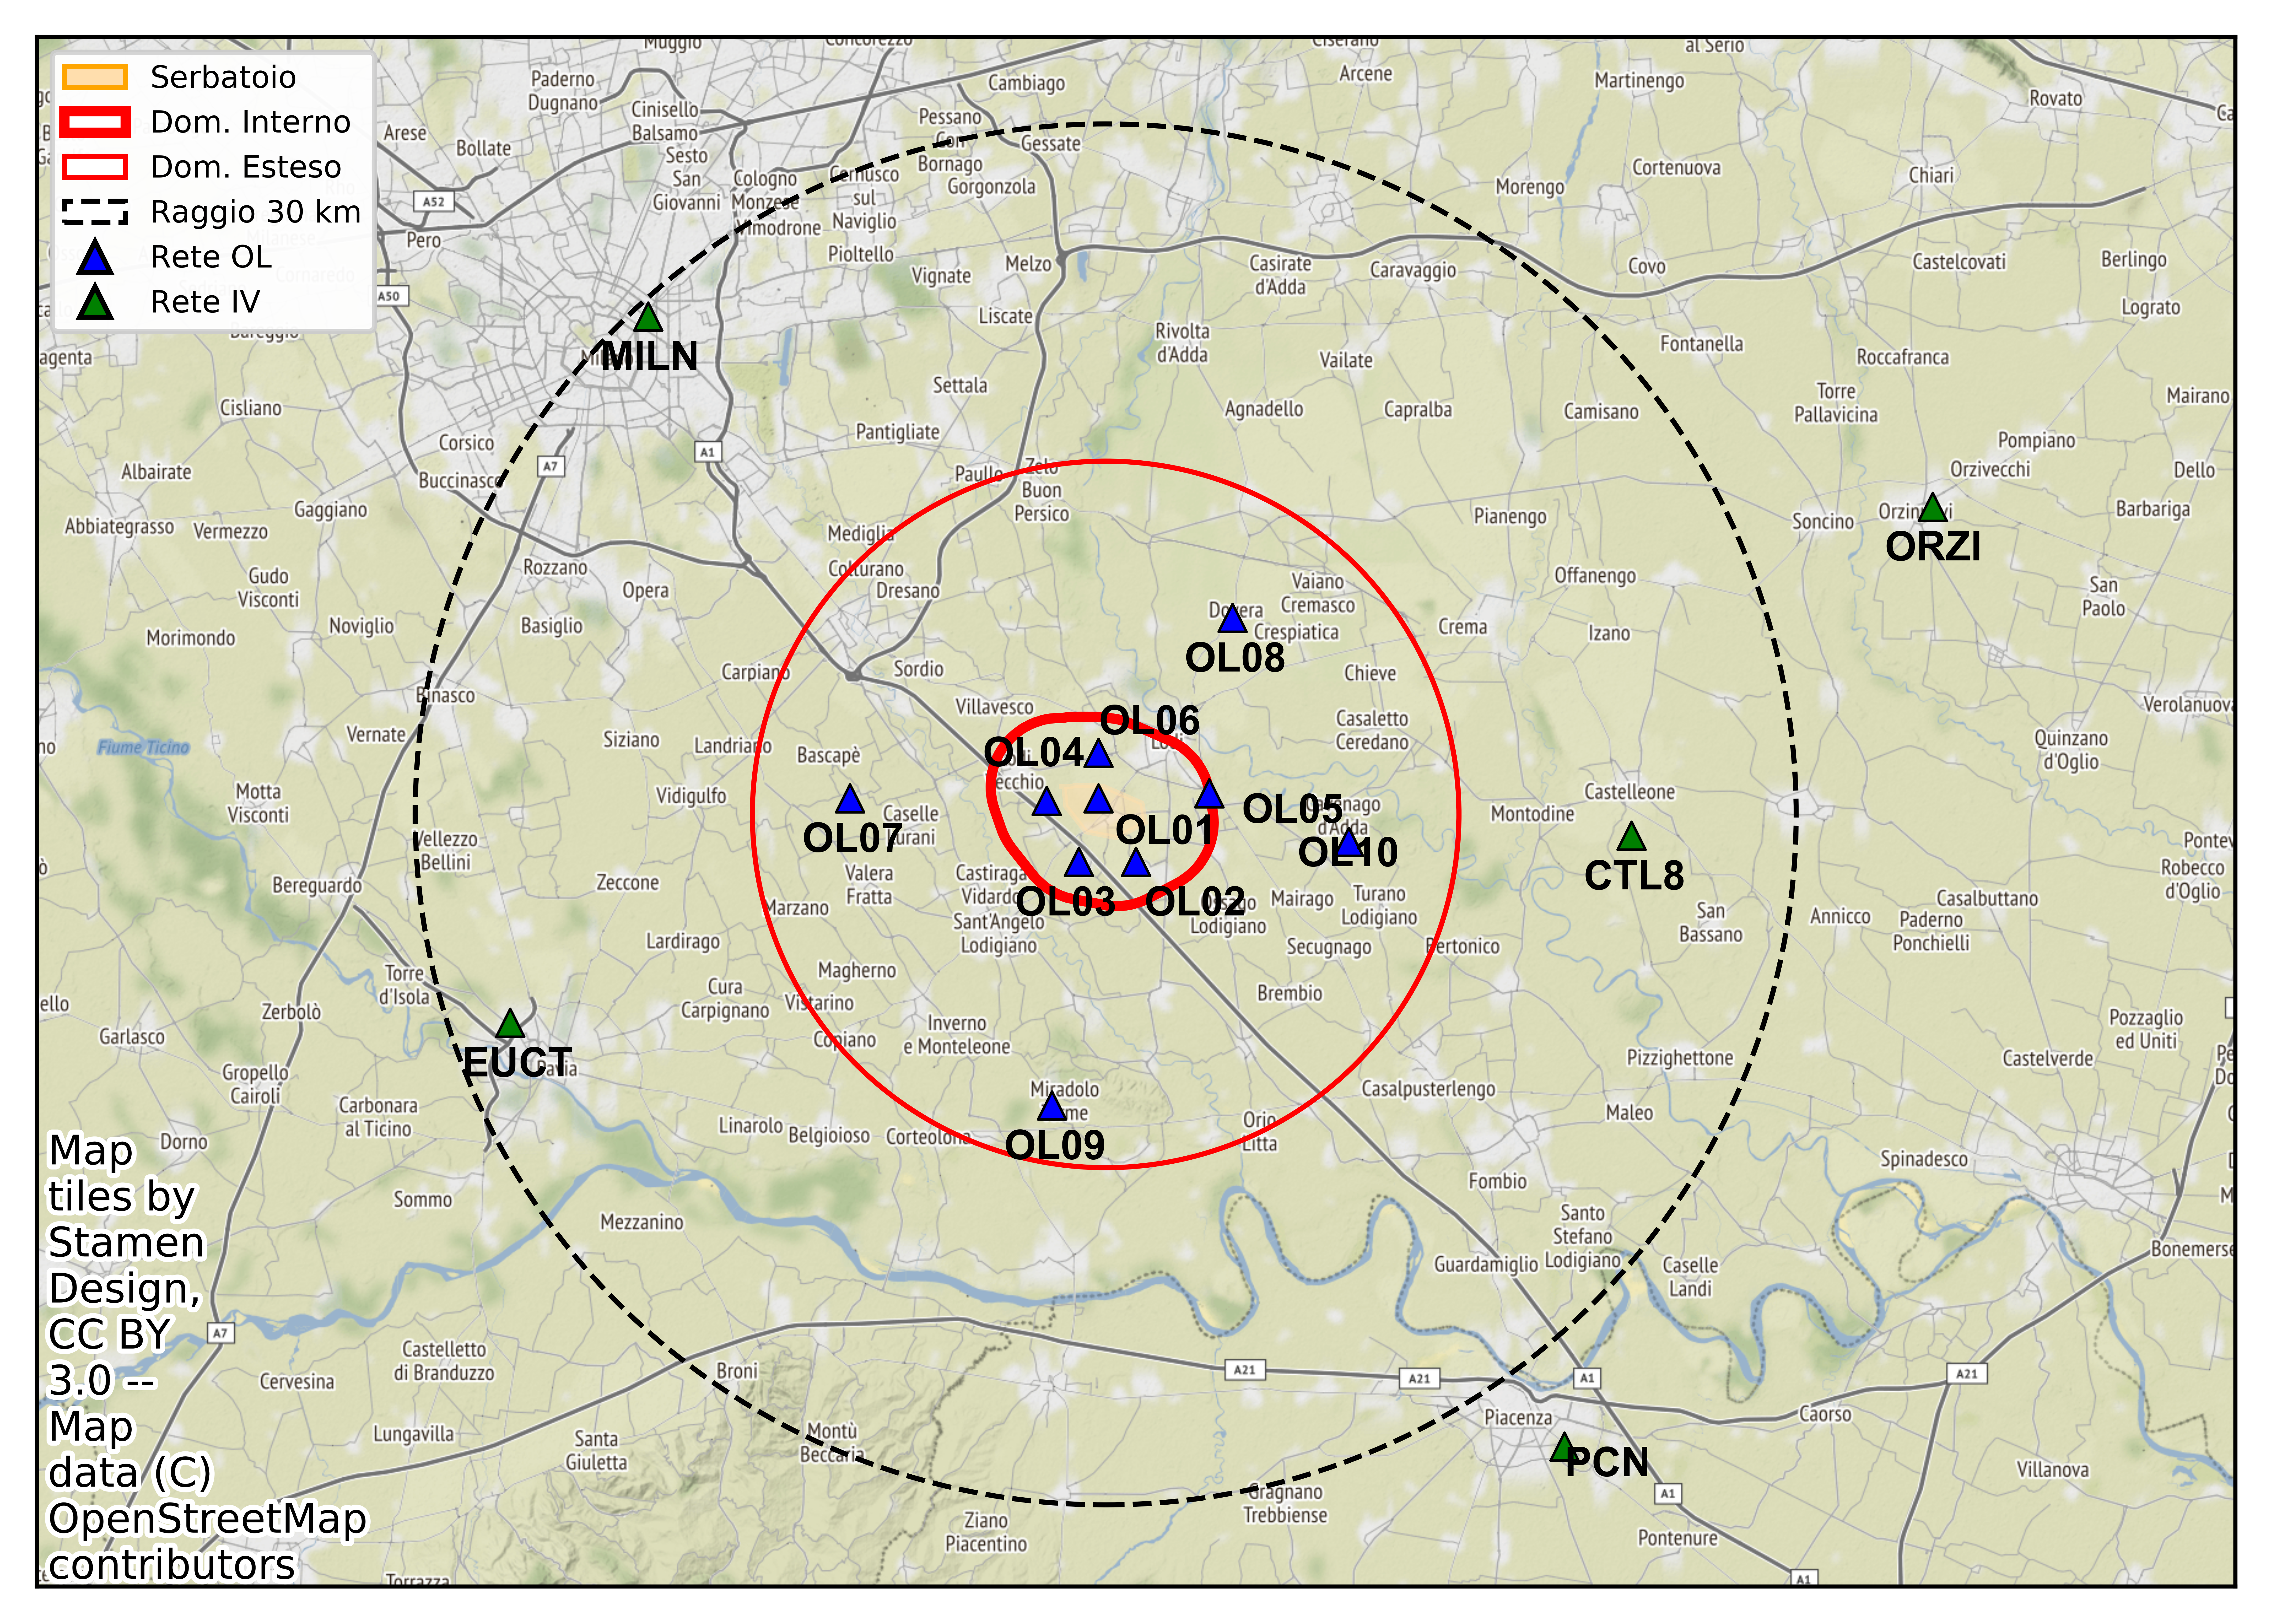
Figure 1 - Map of the seismic monitoring network. The blue and green triangles indicate the RSCL and RSNC stations respectively. The yellow area in the centre indicates the surface projection of the reservoir. The red lines indicate the perimeters of the Inner Domain (DI, thick line) and the Extended Domain (DE, thin line) of detection. The dashed line indicates the Outer Area, corresponding to the distance of 30 km from the storage site.
The data acquisition, processing and analysis procedures are based on the Antelope software system developed by BRTT and completed with procedures and functions developed by OGS researchers and technologists.
We recall that the processing system is divided into two parts, respectively:
• real-time, is the processing part that includes the recognition and automatic localisation of earthquakes with possible notification of local events to on-call personnel;
• off-line, is the part which includes the reprocessing of all data with manual control, and which is carried out periodically on a daily basis or, in the case of a local event, within hours of its occurrence.
The detection of a seismic event takes place, for both processing branches, through some standard operations, which are:
• detection, is the operation in which the recording is analysed to recognise and mark the presence of signal amplitude anomalies (called, in technical terminology, triggers) with respect to the background noise. This operation is carried out according to certain predetermined criteria for all the tracks acquired by the system;
• association, is the operation by which an event is classified as such on the basis that several stations detect triggers with a certain synchrony. The associator evaluates this temporal coincidence for a series of test locations within a well-defined volume and bounded on the surface by the area of interest; if one or more of these locations pass reliability tests, it confirms the best one.
The operations carried out by the two processing branches differ according to different objectives. The real-time system, in the event of an event with a magnitude higher than a pre-established threshold, performs the notification procedures (e.g.: sending alert messages to available personnel, updating tables and notification pages), the off-line branch continues with operations aimed at qualifying the detected events more accurately. For this reason, the two processing branches use different configurations.
Since the objective is to recognise microseismicity, and therefore to detect all seismic events in the study area within the limits of the network's detection capability, the processing tools are configured to allow the identification of weaker signals by exploiting the network's sensitivity to the limit. However, this significantly increases the computational load and the detection of false events, due to the few triggers used. For this reason, downstream of the real-time detection and association operations, the intervention of a seismologist is required, who recognises true events and discriminates them from false ones. This operation of the off-line branch is called tagging. In practice, in this phase, the events of interest for the seismic monitoring of Cornegliano Laudense are permanently tagged in the system.
Once the events have been marked, the following specific operations are carried out:
• extraction of event-related waveforms for all stations;
• manual picking, an operation in which the seismologist re-reads the arrival times of phases P and, where possible, S, to confirm or rectify what has been automatically identified by the system;
• location, using the manually detected phases;
• estimation of magnitude.
Two classic programmes are used for localisation, Hypo 71 (Lee e Lahr, 1975) and Hypoellipse (Lahr, 1999). Both use one-dimensional representations of the Earth's crust, but with an important distinction. Hypo 71 defines the model only in terms of P-wave velocity (Vp) and layer thickness, and uses a constant Vp/Vs ratio for all layers. Recall that the Vp/Vs ratio influences the depth of the hypocenter. Hypoellipse, on the other hand, defines a more specific model, where each layer has its own value of Vp and Vp/Vs.
The Hypo 71 programme is used during the arrival time picking phase to check the quality of the obtained localisations. Hypoellipse is used to relocate all events once the arrival times of phases P and S have been confirmed. As Hypoellipse works on the whole event dataset, the station residuals are recalculated at each run and then applied to the next run. Consequently, with each run of Hypoellipse the localisations may change but also improve in quality. Since the Hypoellipse model is more specific and accurate, the locations shown in the final catalogue are those obtained with Hypoellipse. Regarding the magnitude, the local magnitude (ML) is calculated with the attenuation formula of Bragato e Tento (2005).
IExamples of RSCL recordings are shown in Figure 2. Since the highest signal energy is located in the high frequency band for local and weak events, and shifts towards low frequencies as distance and magnitude increase, we depict the same signal recorded with two different filterings, in low and high frequency respectively. The first pair of figures (a-b) refers to recordings from station OL01 of the M>5 events that occurred in Central Italy on 18 January 2017, at a distance of about 300-400 km from the RSCL. Note the different frequency content of the signals between panels a and b, which correspond to filtering in different frequency bands. The panels in the middle show the recording of a telequake (Mw7.9 on 22 January 2017 with hypocentre in the Pacific Ocean) at station OL04. Also in this case, the wide band of the sensors installed in the well is appreciated. Finally, below are two examples of real-time recordings containing signals of local origin (mostly signals from passing trains). The example refers to station OL09 and to the day 30 January 2017 at 10:07:34 GMT.
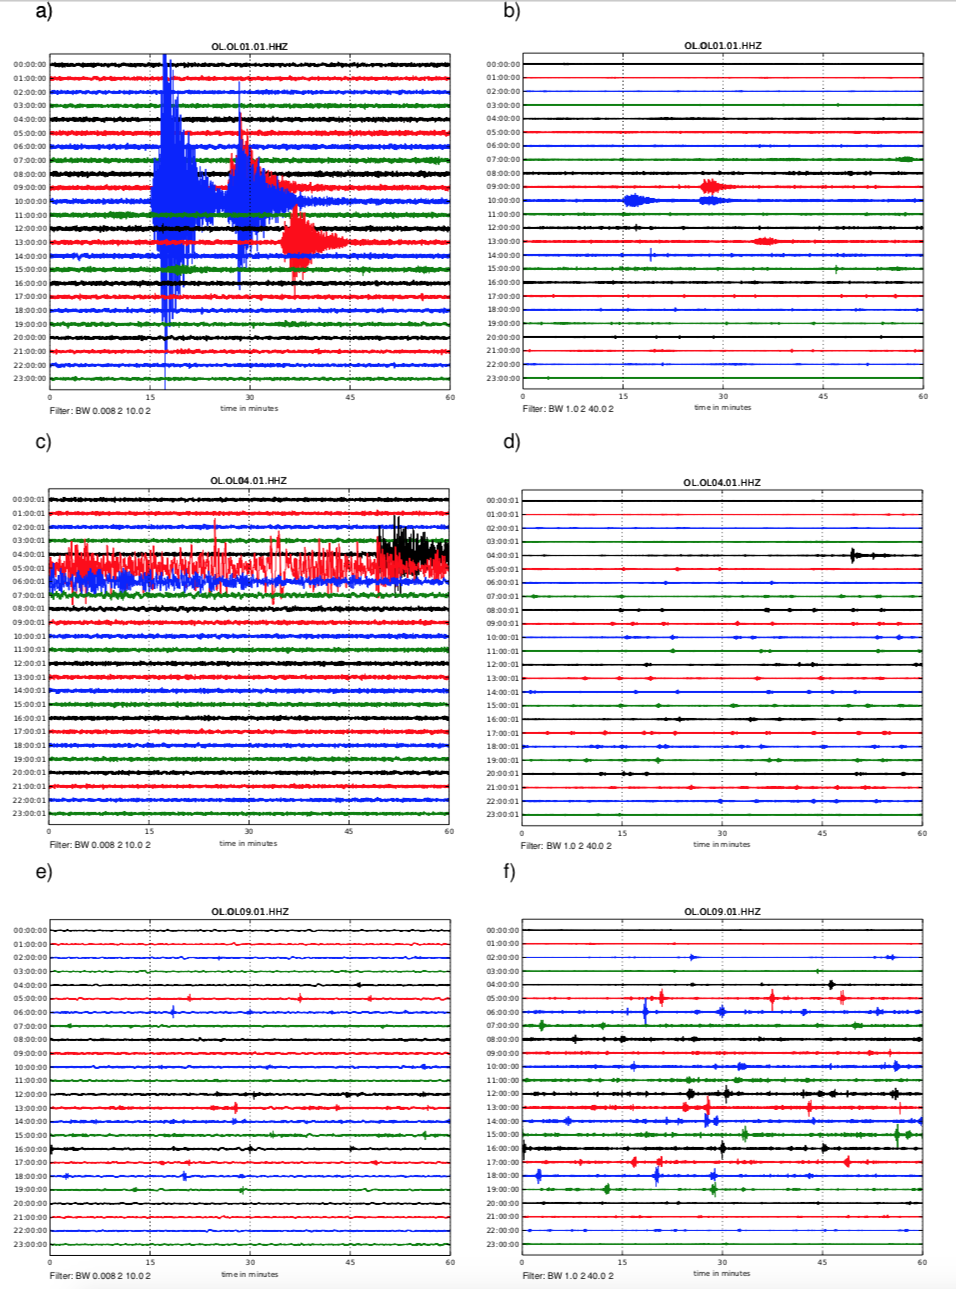
Figure 2 - Examples of RSCL recordings. Each panel represents the recording of one day, and each row corresponds to one hour of recording. The panels shown are organised in columns; on the left the low frequencies are emphasised, on the right the high frequencies. Top: recording at station OL01 on 18/1/2017, subjected to (a) low-pass and (b) high-pass filtering, respectively; the M>5 tremors that occurred in Central Italy can be recognised. Middle: recording at station OL04 of the day 22/1/2017, filtered as above; one recognizes the Mw7.9 tele-quake that occurred in the Pacific Ocean at 04:302:23.8 GMT (source EMSC). Bottom: Real-time recording at station OL09 on 30/1/2017 at 10:07:34 GMT with low-pass (e) and high-pass (f) filtering; recurring signals due to passing trains can be recognised.