


GNSS Station OL01 - Time Series 2017-today
Below are the estimated time series for each Lodi GNSS network site for the time period 1/1/2017 - 31/05/2019. The series are available in two different reference systems: the international one (ITRF08, see description in the "Reports" section) and the European one (EURA, Figures 1-5). In the international system, the displacements and velocities are estimated with respect to a geocentric inertial system that makes evident the motions related to continental drift; these rates are quite important, and, for example, for the horizontal component, they are tens of mm/year for all GPS sites. In the EURA system (Altamimi et al., 2012) the displacements are estimated compared to the European block (or Eurasia), where the average motion of the European plate is subtracted from each site in the network. In the EURA system, therefore, the displacements are significantly smaller than those in the ITRF system, and for example, the rate in the horizontal plane is reduced to a few mm/year. The time series graphs allow a more detailed analysis of the behaviour of each GPS station; this gives an estimate of the movement of the station before the storage activity.
Comparing the Lodi GNSS network station series, a congruent trend between the ITRF and EURA systems can be seen. In particular, the behaviour of the OL01 station, especially in the UP direction, is similar to those of the CREA, CREM, MILA and PAVI stations; this factor shows that the data and related measurements from the OL01 station are representative for a large part of the territory where the station is installed.
Table 1 shows the strain rate estimates for the 5 stations in the reference frame. In the ITRF reference system, where much more pronounced displacements are expected, the values are similar for all GNSS stations (from 16.25 mm/year to 17.26 mm/year in the North coordinate and from 18.95 mm/year to 20.84 mm/year in the East coordinate) and deviate very little from those estimated in the previous report.
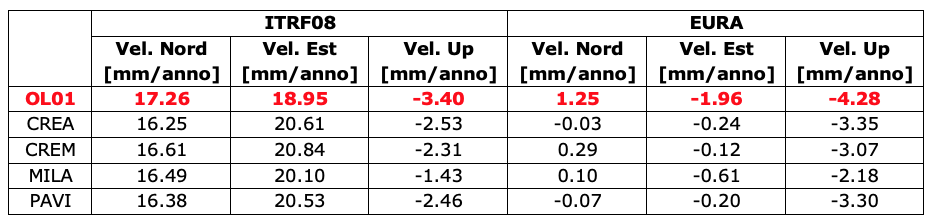
Table 1 - Rates of Lodi GNSS network sites in the ITRF08 and EURA reference systems. The estimates obtained for station OL01 are shown in bold and red.
For the Eurasian reference (EURA), the rate estimates of the OL01 station have to be considered preliminary for two main reasons. The first reason is that the available data are not yet sufficient for a reliable estimation of such low strain rates. Therefore, it is necessary to have a longer observation period. The second reason is that the site is newly built and the time interval for which data are available is within the period of stabilization of the monument. The rate in the UP direction does not change in the two reference systems ITRF and EURA and fluctuates between -1.43 mm/year (MILA) and -4.28 mm/year (OL01).
The results obtained to date related to the analysed stations (Lodi GNSS network) will allow, through comparisons with the CREA, CREM, MILA and PAVI stations, evaluation of the strictly local variations in the movements of the OL01 station.
A last comparison (Figure 6) is made comparing the five stations OL01, CREA, CREM, MILA and PAVI; in particular, the time series of rates in the different components have been compared by removing from each one its previously calculated trend (compared to the EURA reference system). Figure 11 shows the marked local variations and shifts using the net of each rate.
The diagram illustrates that regarding the displacements on the plan and in elevation, all five sites behave in the same way; the trends of the temporal series results are almost overlapping, and significant local displacements are not evinced. At the moment, the processing covers only the first interval of storage activity starting on 12/12/2018; the processing of GNSS data from the OL01 station ends on 31/05/2019, and in the first instance, no abnormal elevations of the ground are observed.
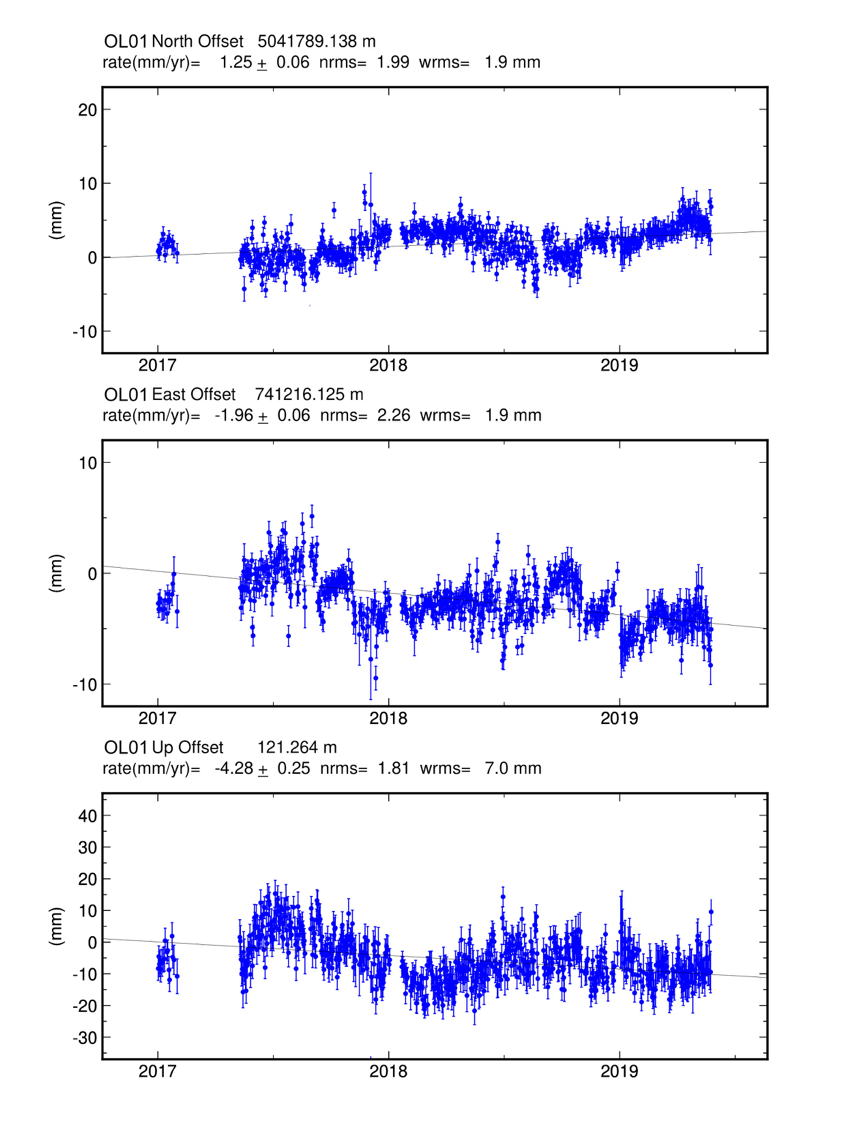
Figure 1 - Time series of OL01 according to the EURA reference system. The first graph above shows the displacement in the NORTH direction of the OL01 station during the measurement period. Each point on the graph is the estimated daily displacement in mm. Each point is superimposed on the error bar representing the dispersion of the 2880 daily estimates. On the graph is the interpolated line whose inclination gives an estimate of rate, with the corresponding error, which is visible on the same graph at the top left (rate (mm/year)). There are also the NRMS (normalized mean squared error) and the WRMS (weighted mean squared error). The following two graphs show the same information for the EAST and UP displacements.
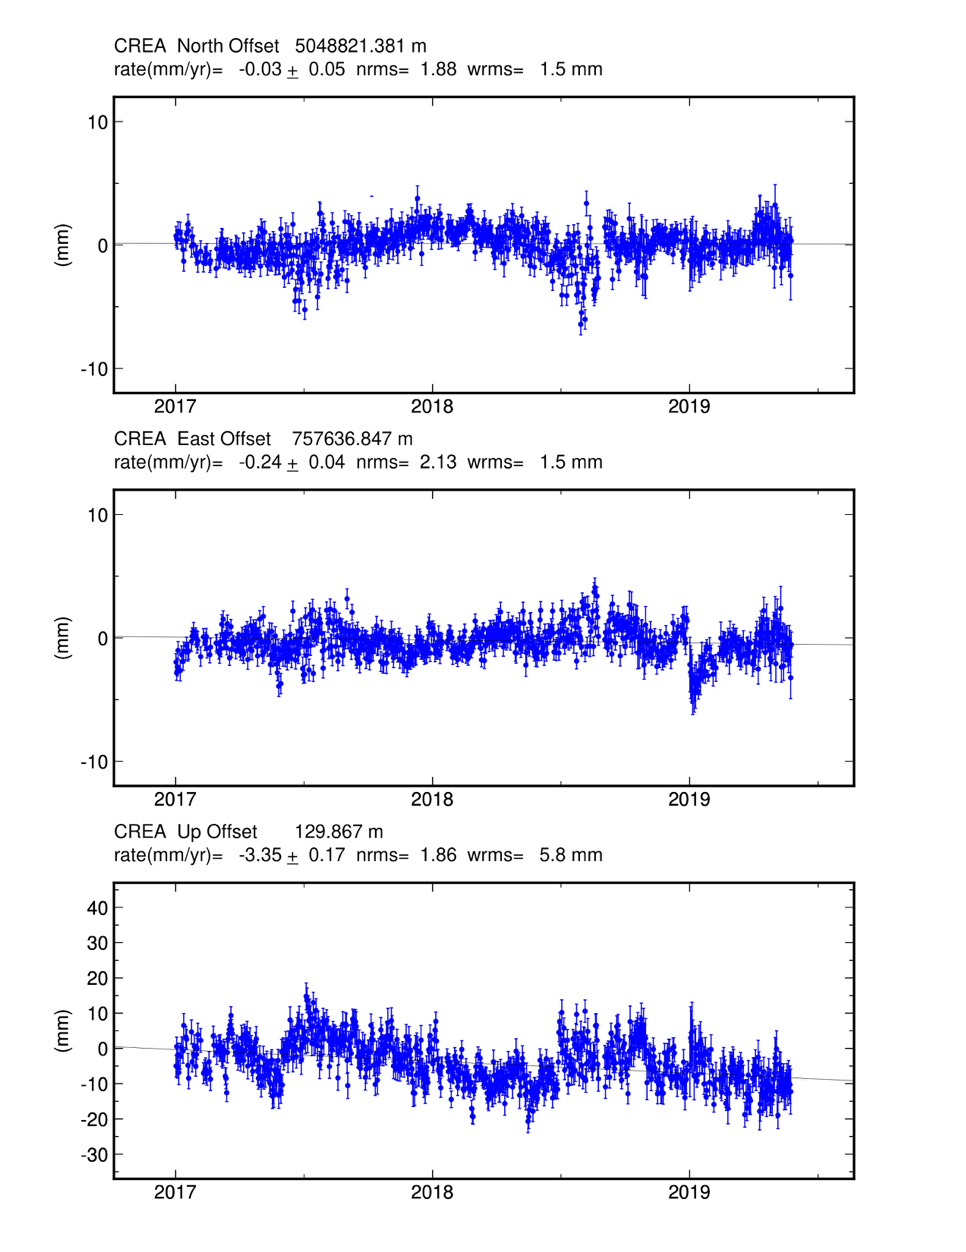
Figure 2 - Time series of the CREA station according to the EURA reference system. The notations on the graphs are the same those as in Figure 1.
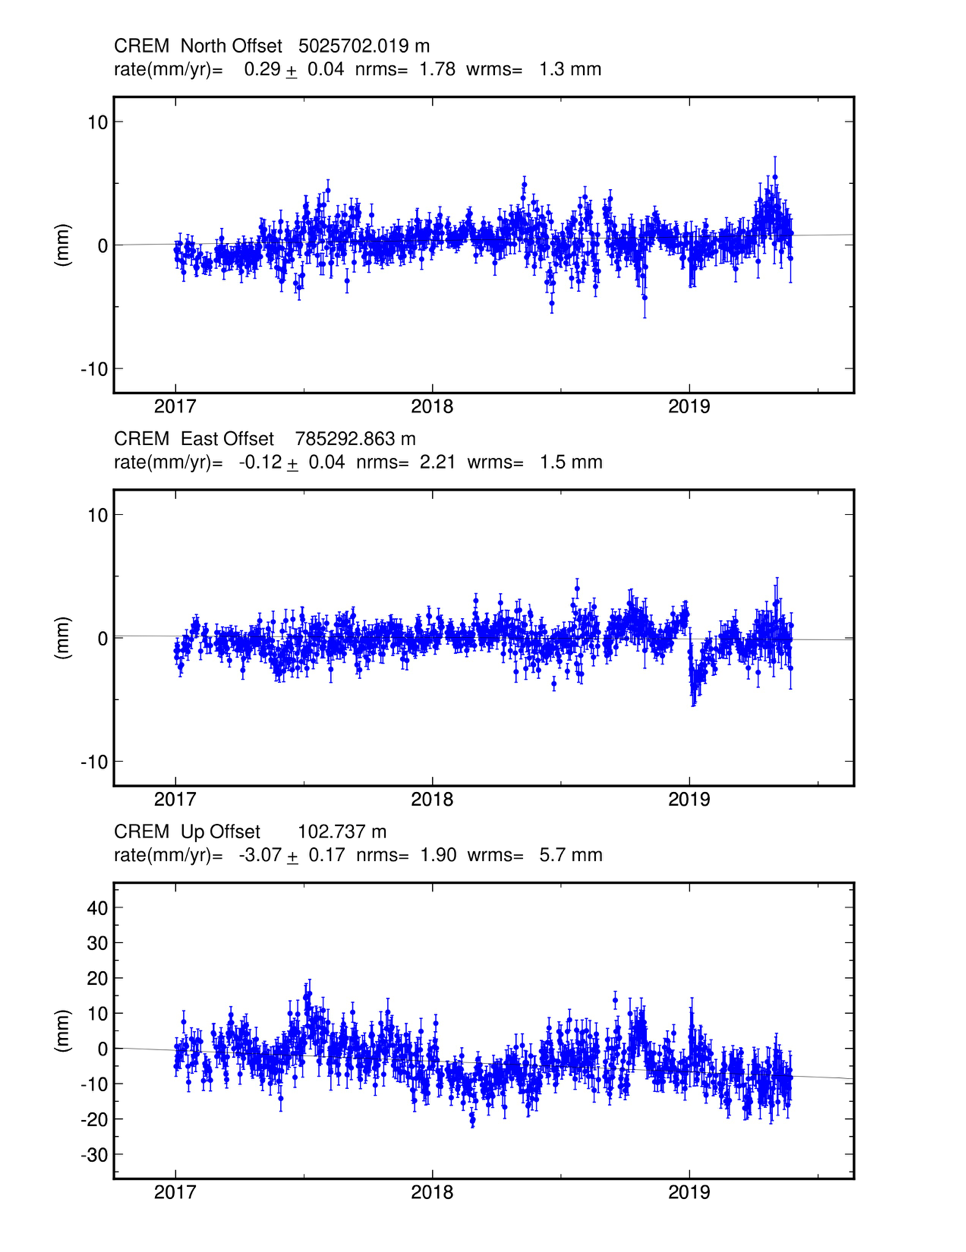
Figure 3 - Time series of the CREM station according to the EURA reference system. The notations on the graphs are the same as those in Figure 1.
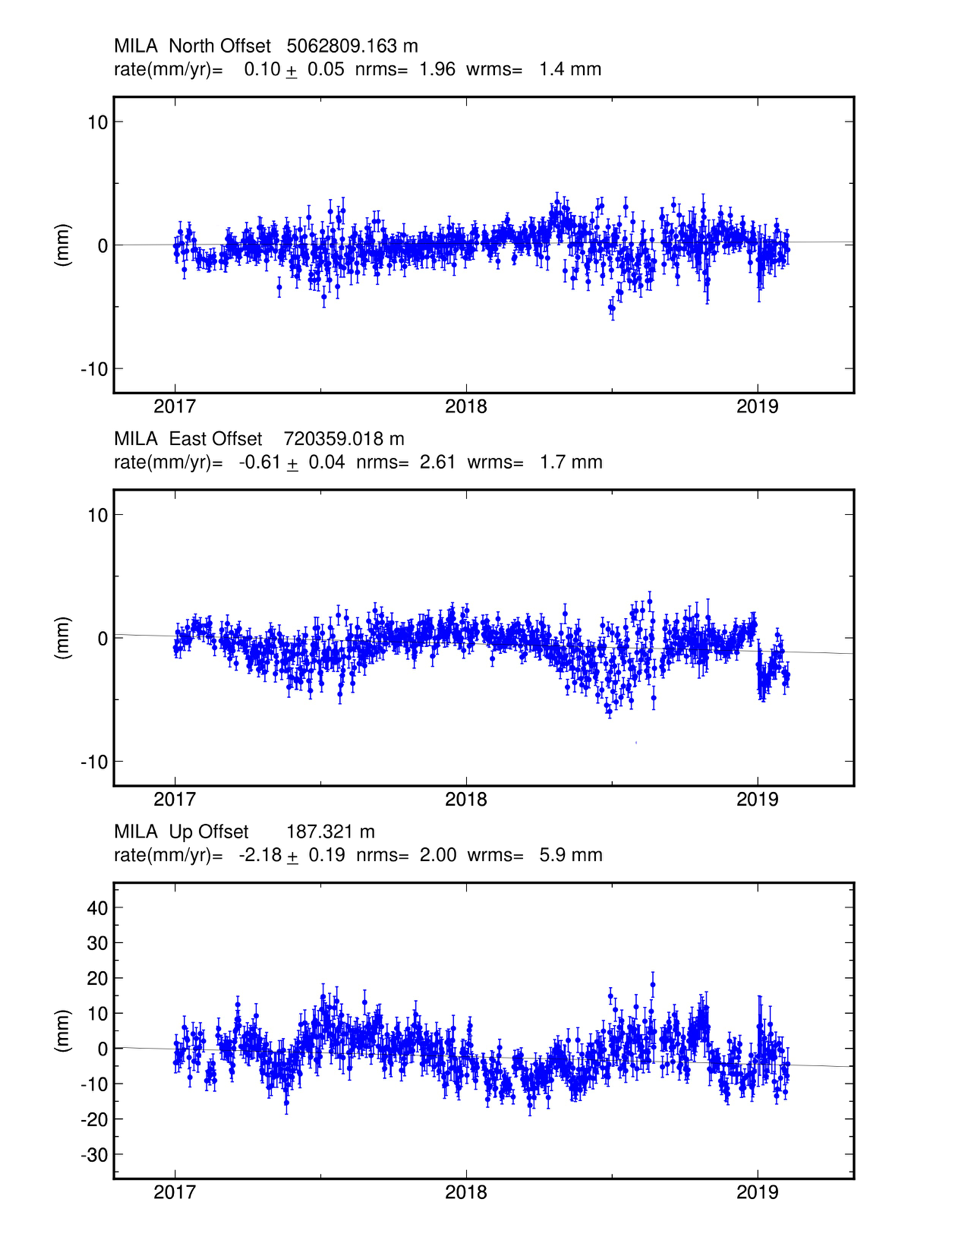
Figure 4 - MILA station time series according to the EURA reference system. The chart notations are the same as those in Figure 1.
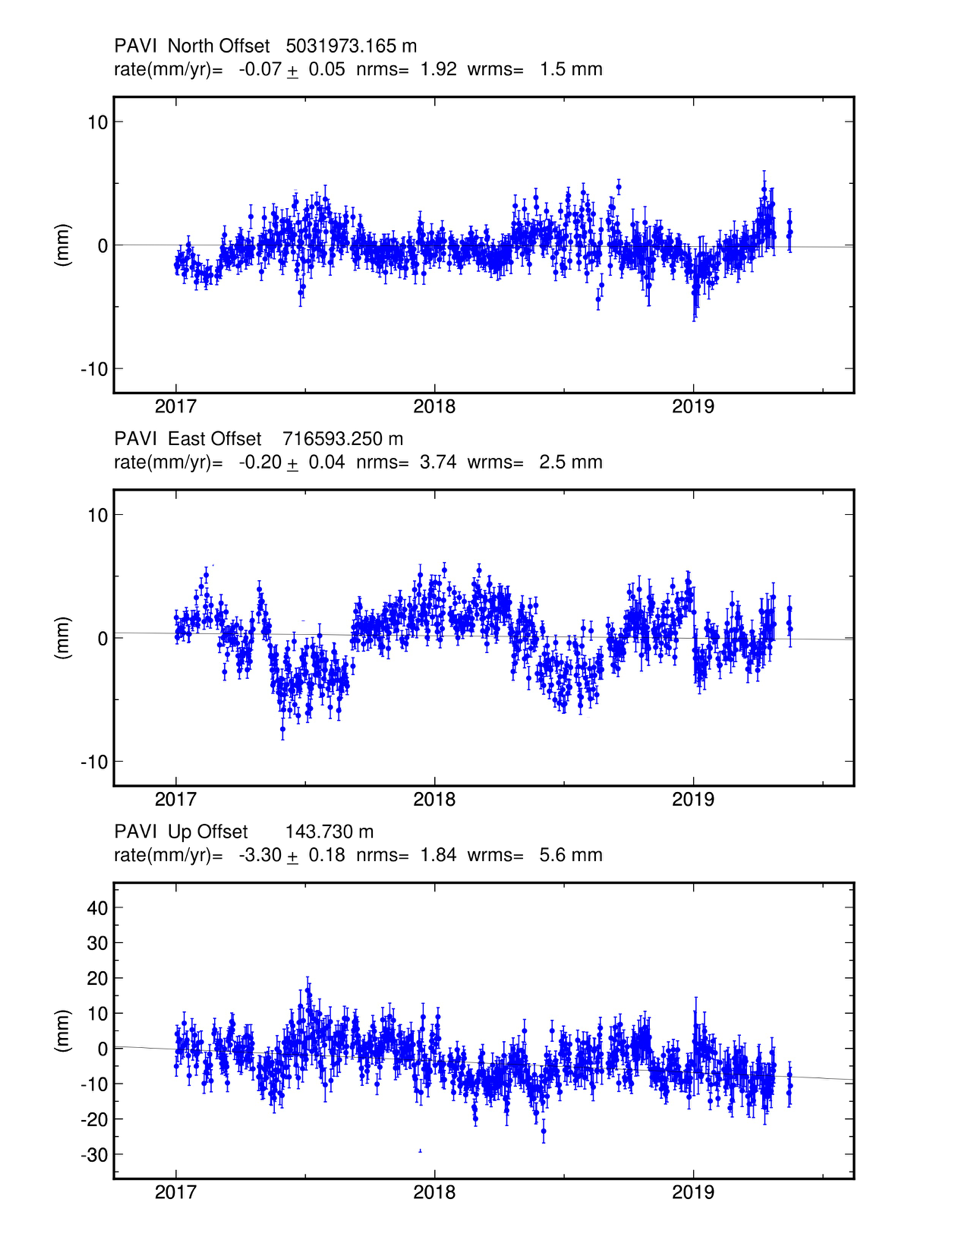
Figure 5 - PAVI station time series according to the EURA reference system. The notations in the graphs are the same as those in Figure 1.
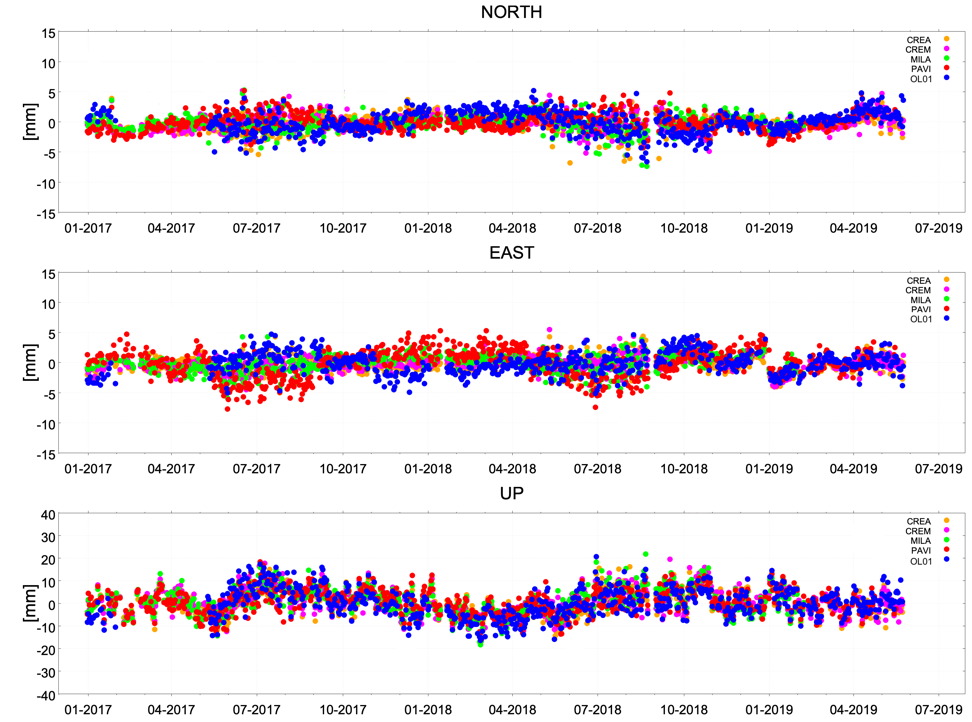
Figure 6 - Time series NORTH, EAST, and UP of the five stations considered: OL01 (blue points), CREA (orange points), CREM (magenta points), MILA (green points) and PAVI (red points). The net of rate trends are calculated according to the European reference system EURA; the time series have been superimposed on the file to identify any local movements.