


Historical and instrumental seismicity
The area under examination is characterized by weak to moderate seismicity. The complete list of earthquakes that have occurred in the area can be obtained from the following sources:
- Parametric Catalogue of Italian Earthquakes – CPT15 (Rovida et al., 2016), which provides homogeneous parametric data, both macroseismic and instrumental, related to earthquakes with maximum observed intensity ≥ V (Mercalli-Cancani-Sieberg (MCS) scale) or magnitude ≥ 4.0 of interest for Italy in the time window 1000-2014. The parametric catalogue is linked to the Italian Macroseismic Database - DBMI15 (Locati et al., 2016), an archive that collects data of macroseismic intensity from different sources related to most of the earthquakes reported in the catalogue.
- Catalogo della Sismicità Italiana – CSI1.1 (Castello et al., 2006), which contains the parameters of instrumental earthquakes from 1981 to 2002. The catalogue collects instrumental data from the National Seismic Network and other local and regional networks managed by other bodies, processed with homogeneous criteria. A new version has subsequently been released, extending the period analysed to 2009, with results not yet satisfactory by admission of the authors.
- Bollettino Sismico Italiano - BSI (http://cnt.rm.ingv.it/bsi) which collects the parameters of earthquakes recorded by the INGV Centralized National Seismic Network, from 1985 through the present. For instrumental seismicity, one can also consult the seismic bulletins of the Regional Seismic Network of Northwestern Italy (RSNI), managed by the University of Genoa - DISTAV (http://www.distav.unige.it/rsni e com. pers. Davide Scafidi), ibecause they are considered, as described below, the most reliable source of microseismic information since the 1980s.
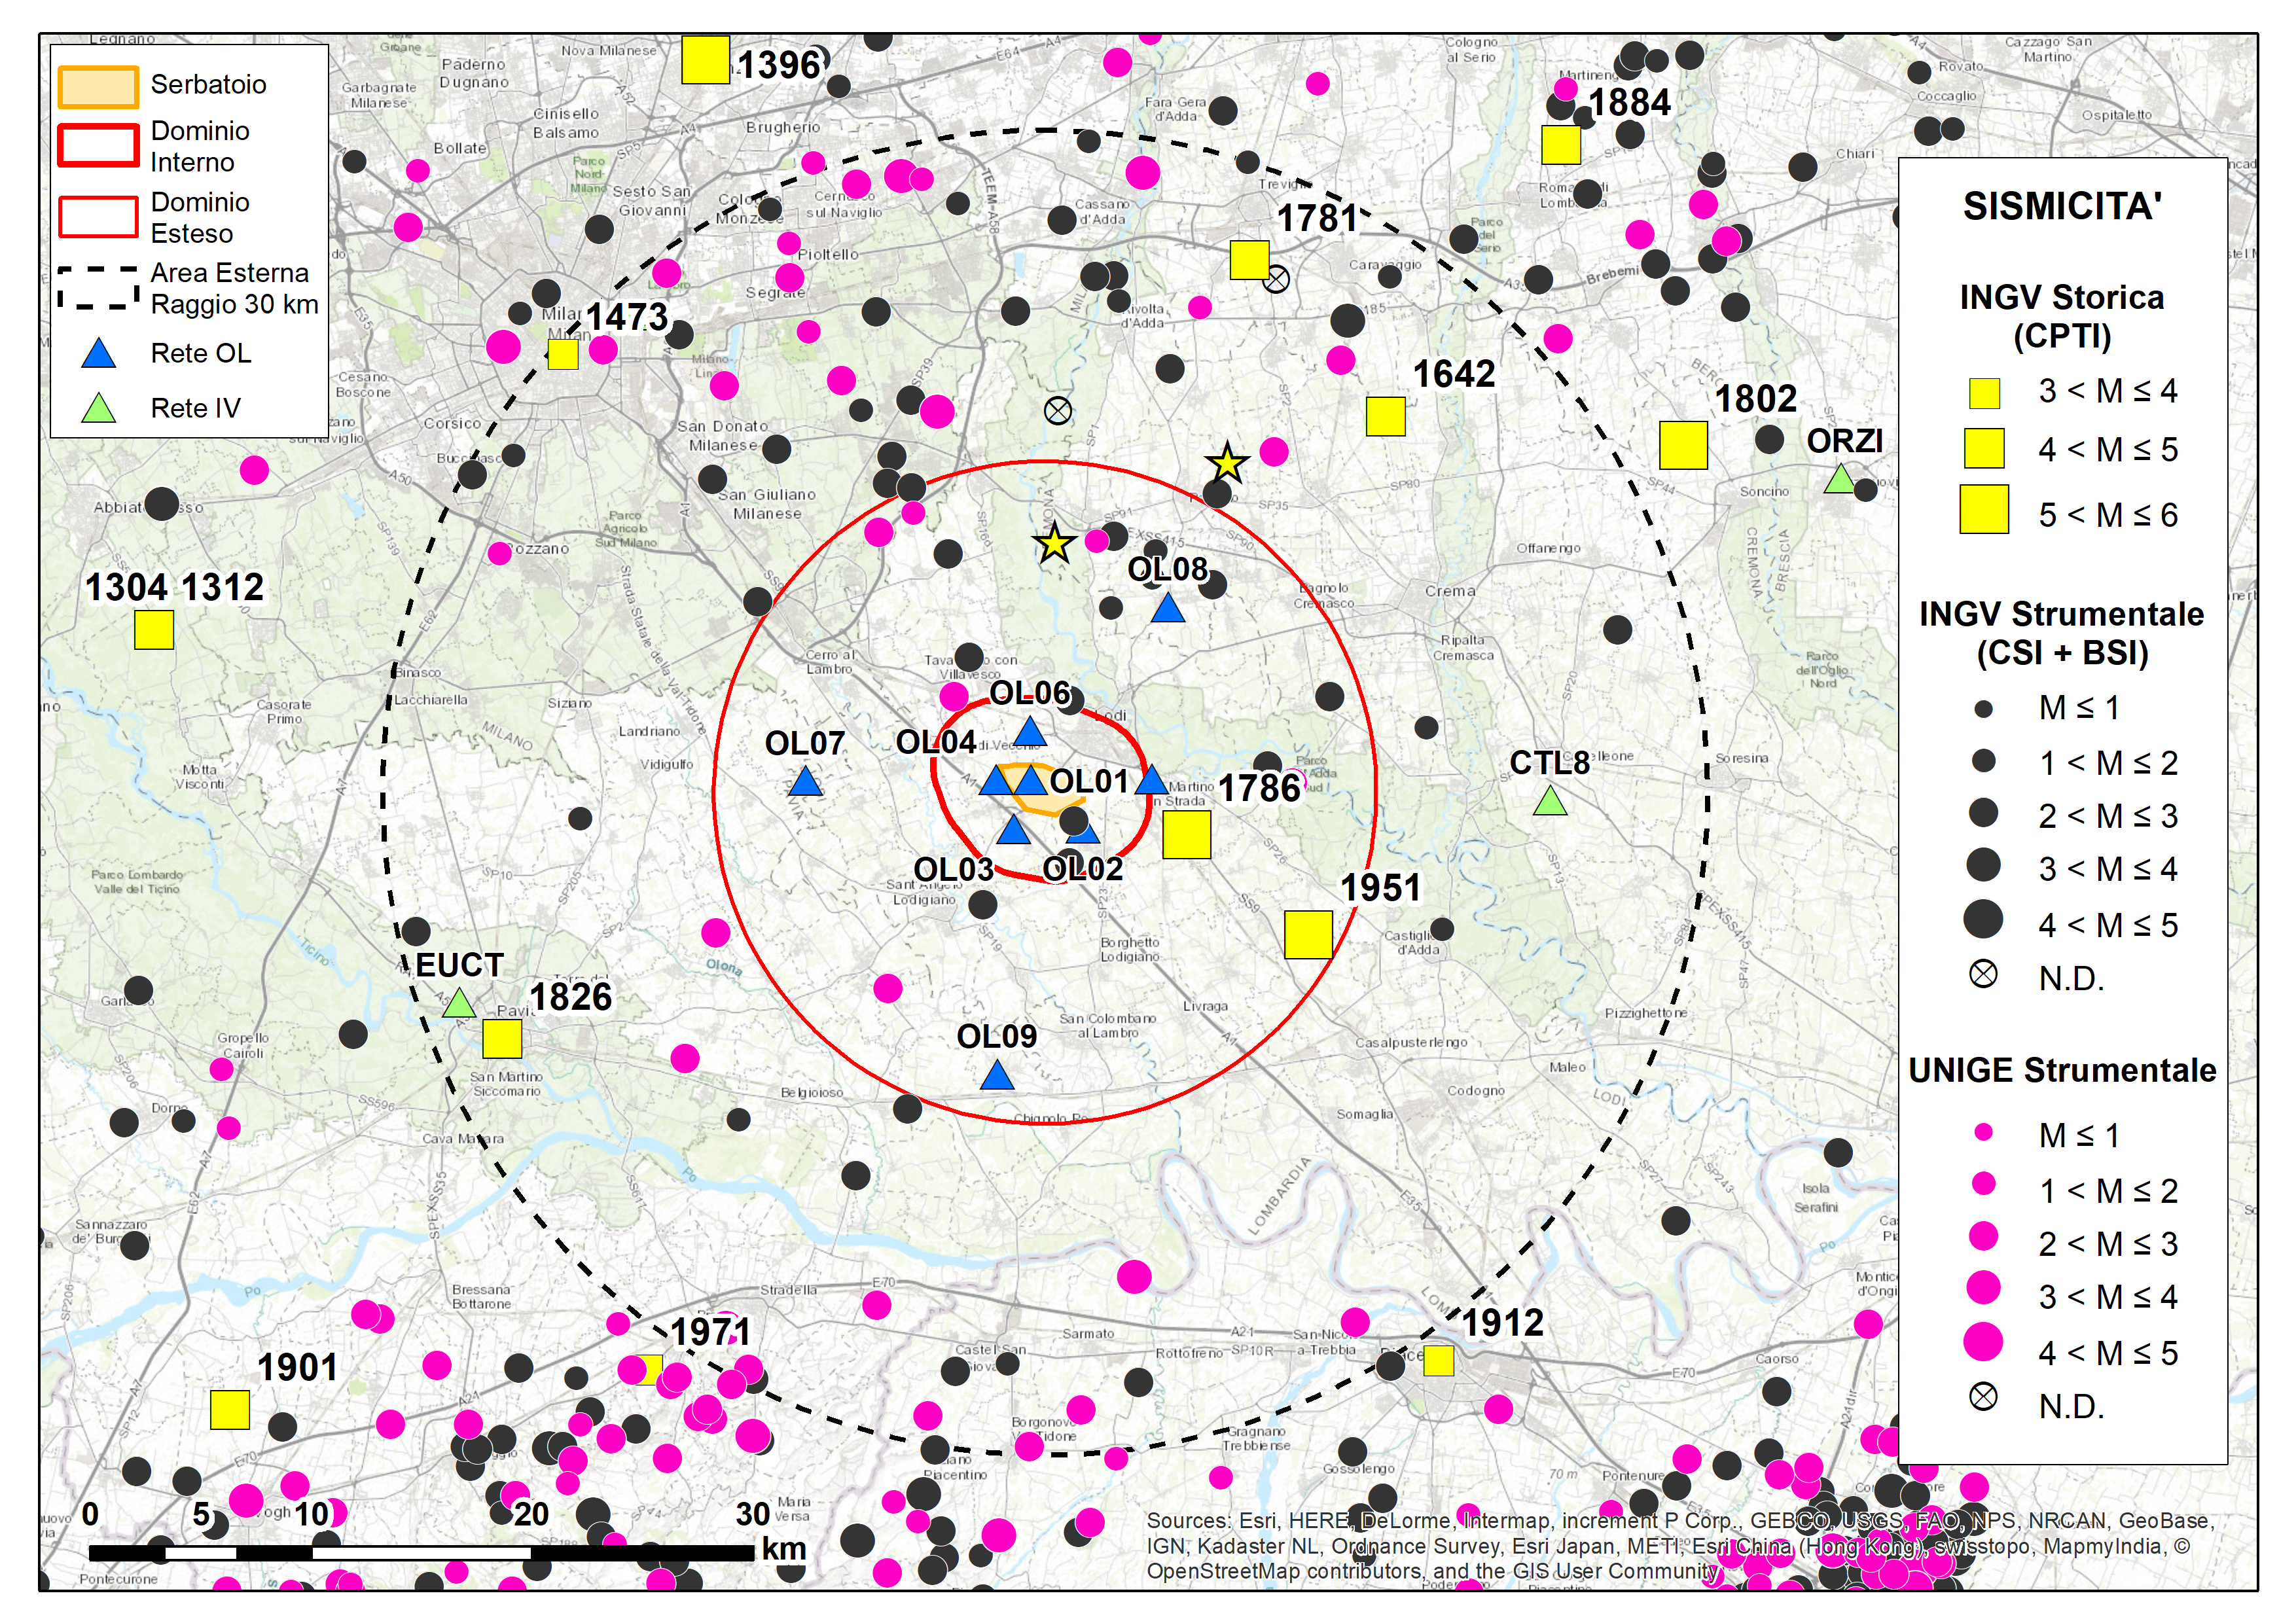
Figure 1 - Map of historical and instrumental seismicity derived from national and regional catalogues for the area around the Cornegliano Laudense storage site. Further details are provided in the text.
Figure 1 shows the events of interest extracted from the above catalogues. These events were selected according to the following time criteria: “CPT15” catalogue until 1980 (yellow symbols in Figure 1), “Catalogo della Sismicità Italiana” from 1981 to 1984, “Bollettino Sismico Italiano” from 1985 to 2018 (black symbols), and RSNI bulletins from 1980 to 2018 (pink symbols).
Regarding the External Area, intended as the area of interest with the greatest extent for this project and delimited by the black dotted circle with a radius of 30 km in Figure 1, the Earthquake Catalogue has already reported events in the Lombard Plain since 1473. The highest magnitude (Mw=5.6, estimated on the basis of macroseismic data) is that of the Oglio Valley earthquake in 1802. The maximum magnitude observed instrumentally is that of the event in 1951 and is equal to 5.2 (Mw estimated by Ms-Mw conversion ratios). Table 1 summarizes some parameters of the main earthquakes, as deduced from CPTI15. Except for the earthquakes of 1786 and 1951 in Lodigiano, all the strongest earthquakes occurred more than 15-20 km from the storage facility.
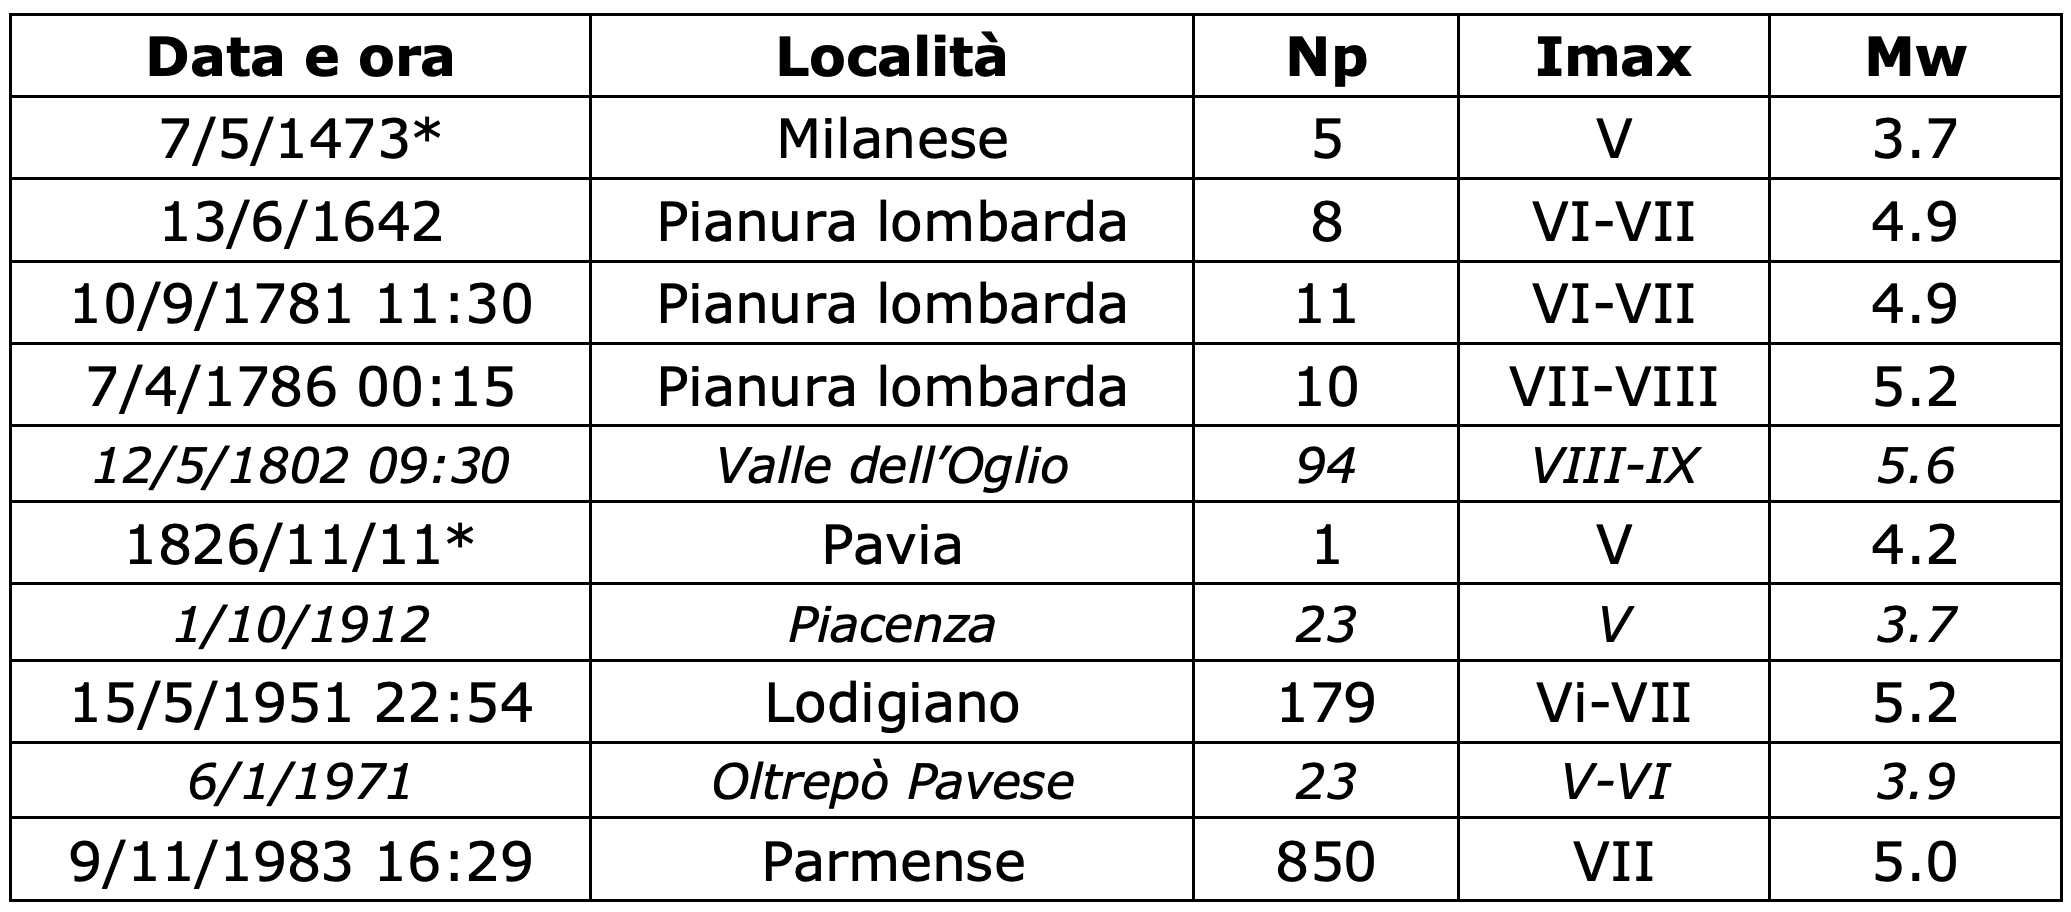
Table 1 - Simplified parameters of events that occurred in the area of greatest interest in this study (data source: DBMI15 macroseismic database, Locati et al., 2016; CPTI15 catalogue, Rovida et al., 2016). The last three columns represent Np, the number of points of the macroseismic field used to parameterize the event; Imax, the maximum observed macroseismic intensity; and Mw, the estimated moment magnitude. Events at the limit of the Extended Area are indicated by italics in Figure 1; the asterisked events have entered the catalogue because of the reduction in the energy threshold considered in CPTI15 compared to previous versions of the catalogue.
It is necessary to consider, however, that both the localizations and the magnitude estimates are affected by great uncertainties, not only for events documented merely by historical sources but also for instrumental events. An exemplary case is the earthquake of greatest interest for the area of Lodi, i.e., that of 15/5/1951, also known as the Caviaga earthquake. Until very few years ago, it was believed that this event was caused by gas extraction activities in the area (Caloi et al., 1956). However, more recent studies place the hypocentre at a depth of approximately 32 km (Caciagli et al., 2015), in a position compatible with that of an inherited fault in the basement (Vannoli et al., 2014), ), thus attributing to the event a tectonic origin and not an anthropogenic origin. The wide extent of the observed macroseismicity presented supports these considerations. Note in Figure 1 the distance between the location of the 1951 earthquake as derived from the distribution of the effects (solid yellow square, located near Castiglione d'Adda) and those obtained from the analysis of instrumental data (yellow stars for the main event and the strongest aftershock, approximately 15 km N of Lodi, taken from Caciagli et al., 2015). With regard to this earthquake, it is also important to note that the macroseismic catalogue does not report damage in the location of Lodi (the closest to Cornegliano Laudense) (Figure 2), while as is clear from the estimated macroseismic field (Figure 3), the earthquake generated damage in all nearby locations and affected a large part of the surrounding area.
Regarding the most recent instrumental seismicity (black and fuchsia symbols in Figure 1), within a radius of 30 km from the RSCL, there are approximately 50 events with magnitudes less than 3.3 reported in national catalogues and 35 in the bulletins of the regional network managed by the University of Genoa (UniGE).
The depths of the events reported in the national catalogues and in the regional bulletins reach high values (relative to the lower crust, as deep as approximately 50 km); these values are also presumably affected by high errors. For the 30 events identified in common by the two networks, the uncertainties in the locations are very high; the average distance between the epicentres is more than 8 km.
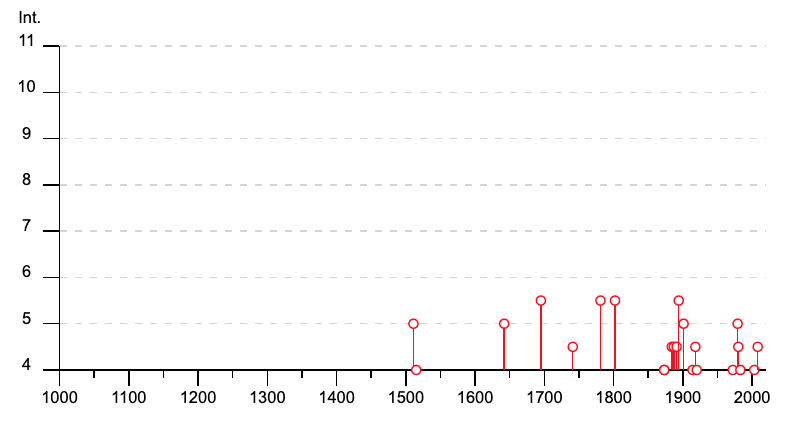
Figure 2 - Seismic history of Lodi (data source: DBMI15 macroseismic database, Locati et al., 2016.
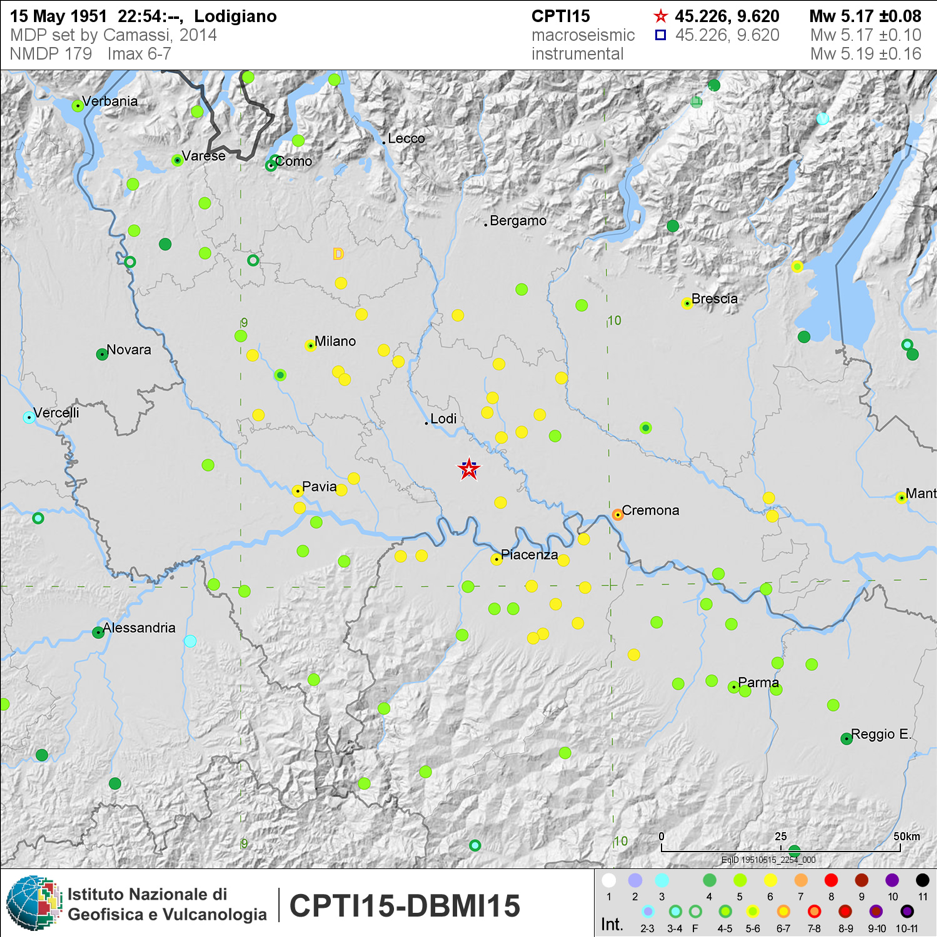
Figure 3 - Macroseismic field of the Lodigiano earthquake of 19/5/1951, also known as the Caviaga earthquake.